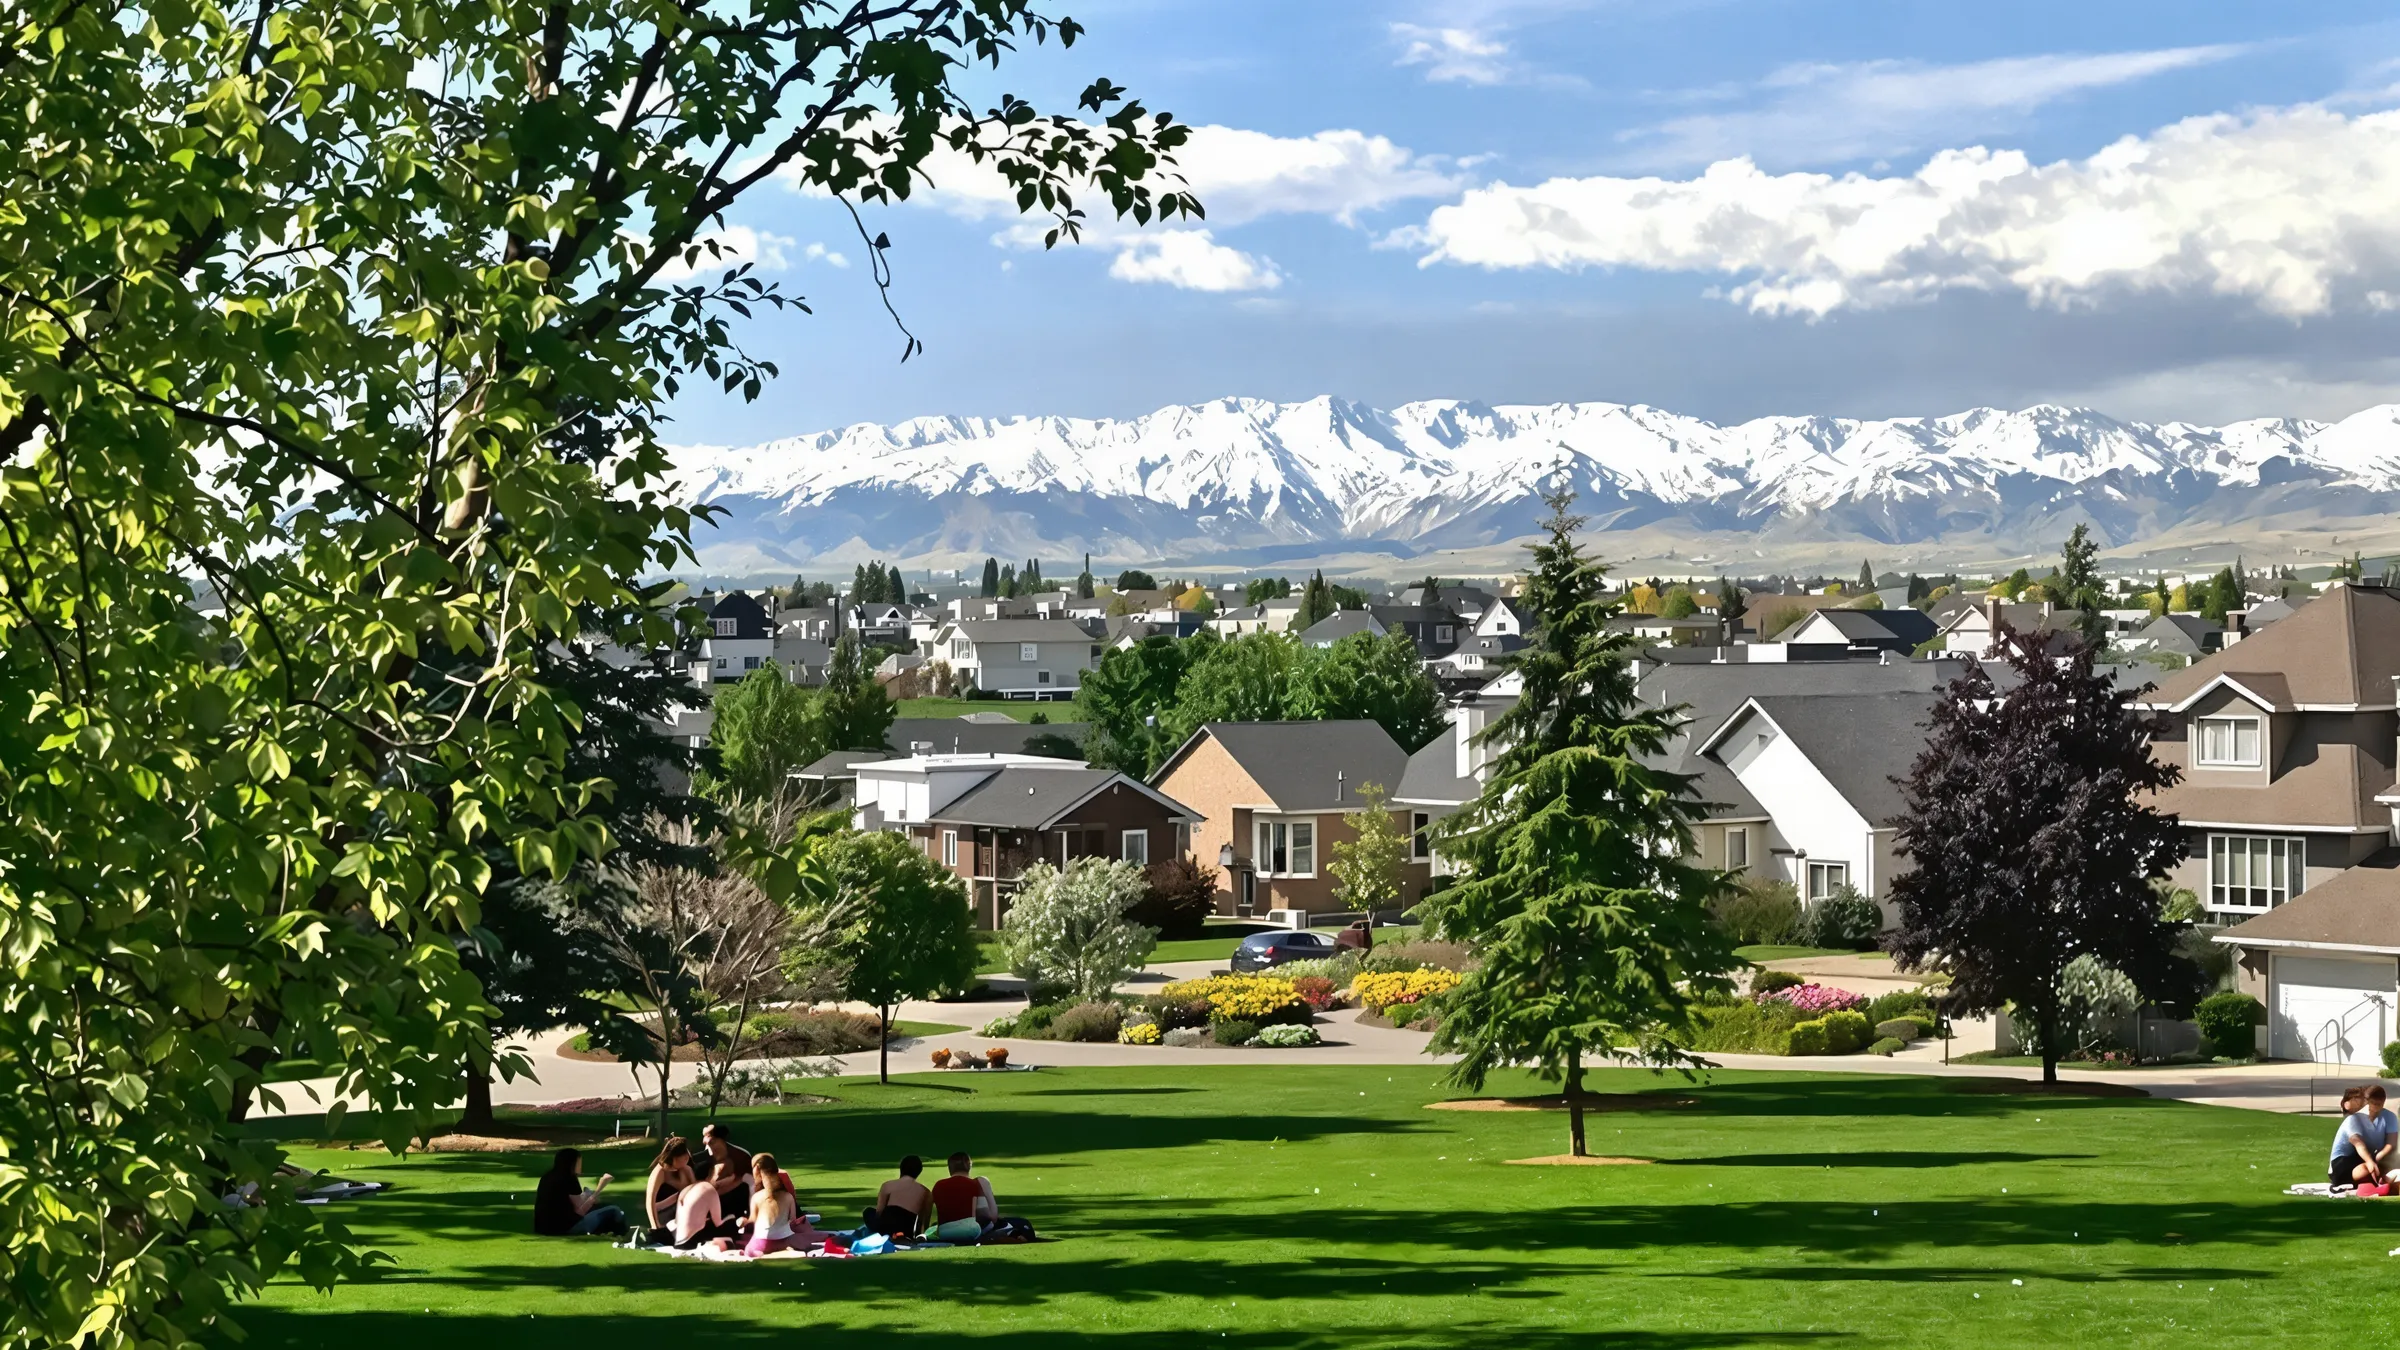
North West Calgary

Scenic suburbs with school power and mountain proximity

Detached median
$750K
Half of detached sales closed above this, half below.
Apartment median
$300K
Half of apartment sales closed above this, half below.
Drive to downtown
21 min
Routed with no traffic, so treat it as a floor.
Homes built since 2010
10%
How much of the housing here is under 16 years old.

Sales to November 3, 2026 (last export 17 days ago)CREB® October 2026

The read

What is true about North West right now?

Over the 12 months to November 3, 2026, a detached home in North West Calgary sold for a median of $750,000, 8% over the city's $695,000, and an apartment for $300,000. Half the detached homes here sold within 21 days. 10% of the district's homes were built since 2010, and the median drive to downtown is 21 minutes with no traffic.

That's the district in one paragraph. Where it sits, and what the location costs in minutes, comes first.

My read

If you want the classic Calgary lifestyle of mountain views, established schools and quiet streets, the North West could be your zone.

Where it sits

Where is North West Calgary, and what does the location cost in minutes?

The median drive to downtown from a North West Calgary community is 21 minutes with no traffic, from 13 minutes for the closest to 32 for the farthest (OpenStreetMap routing; City data, November 9, 2026).
Drive to downtown, median
21 min
Routed with no traffic, so treat it as a floor.
Walk to the nearest transit stop
3 min
Median across communities, to any stop.
Near a frequent bus route
37%
Share of the district within reach of a route that runs every 15 minutes or better.
Communities near a CTrain station
5of 22
Within 1.2 km of a station, straight line.
TuscanyVarsityBownessEdgemontRoyal OakRocky RidgeArbour LakeDalhousieCitadelRanchlandsBrentwoodHawkwoodSilver SpringsScenic AcresMontgomeryHamptonsUniversity DistrictHaskayneCharleswoodCollingwoodGreenwood/GreenbriarUniversity Heights

Key:

  • North West
  • Every ten minutes of driving
  • Hub
  • Driving route
  • Transit stop
  • Frequent route and its stops
  • CTrain station

Each ring is ten minutes of driving from the district's centre. Median drive with no traffic: U of C 14 min, Downtown 21 min, YYC 23 min, Quarry Park 30 min and South Health 39 min. Tap a figure above the map to show it.

OpenStreetMap routing, no traffic. Calgary Transit GTFS. City data, November 9, 2026.

Drive to downtown, shortest first

Near a frequent bus route, highest first

Walk to a transit stop, shortest first

Getting around, from someone who lives here

The Red Line runs from Tuscany to downtown. Driving can be slower at rush hour; Crowchild Trail bottlenecks are common.

Errands. Moderate. Market Mall, Crowfoot Crossing and Beacon Hill cover most needs.

The North West isn't the fastest for cross-city commuting, but it's self-sufficient. You'll rarely need to leave unless you want to.

The communities inside it are where the decision gets made.

Communities

Which North West communities should you look at, and why?

22 communities, each read from the record: what kind of place it is, what its homes sell for, where it ranks and what to watch for.
TuscanyVarsityBownessEdgemontRoyal OakRocky RidgeArbour LakeDalhousieCitadelRanchlandsBrentwoodHawkwoodSilver SpringsScenic AcresMontgomeryHamptonsUniversity DistrictHaskayneCharleswoodCollingwoodGreenwood/GreenbriarUniversity Heights
  • Lake community
  • Riverside community
  • New community, still being built
  • Established community
  • Community

Kinds of place here come from a lake inside the community, the Bow River valley, how much was built since 2010 and how much is still being built. Pick a community on the map to open its profile below.

City boundaries, OpenStreetMap water, 2026 assessment roll, City facilities.

In order of entry price, lowest first.

1 of 22

Dalhousie

Established community

3,299 homes, 99% of homes built before 2010, detached from $663K.

What stands out

  • 4 schools inside the community
  • 2 off-leash dog parks inside
  • Among the lowest entry prices in the district: from $198K
  • 11 playgrounds, 5 childcare programs
  • 13% of the land is park
Entry price
$198K
lowest 25th-percentile sold price of any type
Detached median
$715K
62 sales

By home type 12 months to November 3, 2026

TypeMedian soldAgainst North WestDays to sellA quarter sold under
Detached62 sales$715K16th highest of 20$35K below18North West: 21$663K
Semi-detached11 sales$515K5th highest of 5$144K below19North West: 24$488K
Townhouse12 sales$367K12th highest of 13$64K below36North West: 30$317K
Apartment41 sales$212K11th highest of 11$88K below52North West: 44$198K

Edgemont

Established community

5,315 homes, 100% of homes built before 2010, detached from $709K.

What stands out

  • Most park space in the district: 32% of the land
  • 3 schools inside the community
  • 4 off-leash dog parks inside
  • Among the lowest entry prices in the district: from $203K
  • 20 playgrounds, 7 childcare programs

Watch for

  • Among the highest apartment condo fees in the district ($684 a month on the median resale)
  • Little frequent transit
Entry price
$203K
lowest 25th-percentile sold price of any type
Detached median
$814K
112 sales

By home type 12 months to November 3, 2026

TypeMedian soldAgainst North WestDays to sellA quarter sold under
Detached112 sales$814K8th highest of 20$64K above21North West: 21$709K
Townhouse15 sales$525K3rd highest of 13$95K above29North West: 30$433K
Apartment17 sales$220K10th highest of 11$80K below37North West: 44$203K

Royal Oak

Established community

4,170 homes, 97% of homes built before 2010, detached from $670K.

What stands out

  • 3 schools inside the community
  • Among the lowest entry prices in the district: from $216K
  • 9 playgrounds, 2 childcare programs
  • 16% of the land is park
  • 24 ha of natural area

Watch for

  • Little frequent transit
Entry price
$216K
lowest 25th-percentile sold price of any type
Detached median
$759K
96 sales

By home type 12 months to November 3, 2026

TypeMedian soldAgainst North WestDays to sellA quarter sold under
Detached96 sales$759K12th highest of 20$9K above20North West: 21$670K
Townhouse19 sales$440K7th highest of 13$10K above36North West: 30$393K
Apartment30 sales$241K9th highest of 11$59K below41North West: 44$216K

Varsity

Riverside community

4,808 homes, 91% of homes built before 2010, detached from $735K.

What stands out

  • Bow River valley pathways, 4 km of regional pathway
  • Sir Winston Churchill Aquatic & Recreation Centre inside
  • 9 schools inside the community
  • 3 off-leash dog parks inside
  • Most shops and services in the district: 158 places

Watch for

  • Among the highest apartment condo fees in the district ($666 a month on the median resale)
  • 3% of lots back onto the busiest roads
Next to the University of Calgary and Market Mall, with steady demand from owners and investors.
My note
Entry price
$235K
lowest 25th-percentile sold price of any type
Detached median
$881K
91 sales

By home type 12 months to November 3, 2026

TypeMedian soldAgainst North WestDays to sellA quarter sold under
Detached91 sales$881K3rd highest of 20$131K above21North West: 21$735K
Townhouse40 sales$493K5th highest of 13$63K above26North West: 30$413K
Apartment69 sales$284K7th highest of 11$16K below41North West: 44$235K

Haskayne

New community, still being built

1,389 homes, 100% of homes built since 2010, detached from $781K.

What stands out

  • River valley pathways, 6 km of regional pathway
  • Most park space in the district: 32% of the land
  • Newest homes in the district: 100% built since 2010
  • 6 playgrounds, 1 childcare program
  • 174 ha of natural area

Watch for

  • 8% of lots sit beside freight rail
  • Little frequent transit
Entry price
$242K
lowest 25th-percentile sold price of any type
Detached median
$850K
46 sales

By home type 12 months to November 3, 2026

TypeMedian soldAgainst North WestDays to sellA quarter sold under
Detached46 sales$850K5th highest of 20$100K above43North West: 21$781K
Townhouse11 sales$473K6th highest of 13$43K above48North West: 30$242K

Brentwood

Community

2,732 homes, 28% of homes built since 2010, detached from $675K.

What stands out

  • Sir Winston Churchill Aquatic & Recreation Centre inside
  • 7 schools inside the community
  • 2 off-leash dog parks inside
  • Nose Hill Library inside
  • 2 playgrounds, 9 childcare programs
Next to the University of Calgary and Market Mall, with steady demand from owners and investors.
My note
Entry price
$261K
lowest 25th-percentile sold price of any type
Detached median
$725K
69 sales

By home type 12 months to November 3, 2026

TypeMedian soldAgainst North WestDays to sellA quarter sold under
Detached69 sales$725Ktied for 14th highest of 20$25K below24North West: 21$675K
Apartment29 sales$278K8th highest of 11$23K below47North West: 44$261K

Rocky Ridge

Established community

3,212 homes, 87% of homes built before 2010, detached from $717K.

What stands out

  • 1 school inside the community
  • 5 playgrounds, 1 childcare program
  • 23% of the land is park
  • 37 ha of natural area
  • Bungalows: 20% of detached sales were single-level

Watch for

  • Little frequent transit
Entry price
$280K
lowest 25th-percentile sold price of any type
Detached median
$815K
59 sales

By home type 12 months to November 3, 2026

TypeMedian soldAgainst North WestDays to sellA quarter sold under
Detached59 sales$815K7th highest of 20$65K above23North West: 21$717K
Semi-detached13 sales$650K3rd highest of 5$9K below21North West: 24$600K
Townhouse27 sales$382K11th highest of 13$48K below32North West: 30$335K
Apartment24 sales$305K5th highest of 11About the same22North West: 44$280K

Hawkwood

Established community

3,325 homes, 100% of homes built before 2010, detached from $675K.

What stands out

  • 2 schools inside the community
  • 4 off-leash dog parks inside
  • Established streets: 0% built since 2010, grown-in yards
  • 17 playgrounds, 5 childcare programs
  • 15% of the land is park

Watch for

  • Little frequent transit
Entry price
$286K
lowest 25th-percentile sold price of any type
Detached median
$725K
70 sales

By home type 12 months to November 3, 2026

TypeMedian soldAgainst North WestDays to sellA quarter sold under
Detached70 sales$725Ktied for 14th highest of 20$25K below22North West: 21$675K
Apartment11 sales$300K6th highest of 11About the same52North West: 44$286K

Arbour Lake

Lake community

3,809 homes, 94% of homes built before 2010, detached from $611K.

What stands out

  • Arbour Lake inside the community
  • Melcor YMCA at Crowfoot inside
  • 3 schools inside the community
  • Most shops and services in the district: 79 places
  • Crowfoot Library inside

Watch for

  • Check title for a lake association fee
Mountain views, quick access to Crowchild and Stoney, and a resident lake in Arbour Lake.
My note
Entry price
$290K
lowest 25th-percentile sold price of any type
Detached median
$683K
87 sales

By home type 12 months to November 3, 2026

TypeMedian soldAgainst North WestDays to sellA quarter sold under
Detached87 sales$683K17th highest of 20$67K below24North West: 21$611K
Apartment42 sales$315K4th highest of 11$15K above43North West: 44$290K

Bowness

Riverside community

3,728 homes, 86% of homes built before 2010, detached from $559K.

What stands out

  • Bow River valley pathways, 6 km of regional pathway
  • Shouldice Aquatic Centre inside
  • 9 schools inside the community
  • Bowness Library inside
  • 18 playgrounds, 11 childcare programs

Watch for

  • 8% of lots sit in the regulatory flood zone
  • 22% of lots sit beside freight rail
Entry price
$295K
lowest 25th-percentile sold price of any type
Detached median
$629K
92 sales

By home type 12 months to November 3, 2026

TypeMedian soldAgainst North WestDays to sellA quarter sold under
Detached92 sales$629K19th highest of 20$121K below20North West: 21$559K
Semi-detached51 sales$735K2nd highest of 5$76K above30North West: 24$524K
Townhouse25 sales$390K10th highest of 13$40K below37North West: 30$295K

Greenwood/Greenbriar

New community, still being built

381 homes, 100% of homes built since 2010, apartments from $311K.

What stands out

  • Backs onto the river valley
  • Newest homes in the district: 100% built since 2010
  • 1 off-leash dog park inside
  • 3 playgrounds
  • 12% of the land is park

Watch for

  • A thin resale record: 28 sales in the window
  • Little frequent transit
Entry price
$311K
lowest 25th-percentile sold price of any type
Apartment median
$384K
11 sales

By home type 12 months to November 3, 2026

TypeMedian soldAgainst North WestDays to sellA quarter sold under
Apartment11 sales$384K3rd highest of 11$84K above34North West: 44$311K

Tuscany

Established community

6,757 homes, 96% of homes built before 2010, detached from $630K.

What stands out

  • 4 schools inside the community
  • 2 off-leash dog parks inside
  • 20 playgrounds, 5 childcare programs
  • 30% of the land is park
  • 162 ha of natural area

Watch for

  • Among the highest apartment condo fees in the district ($650 a month on the median resale)
Walkable, with the Red Line's Tuscany station and community-run events.
My note
Entry price
$333K
lowest 25th-percentile sold price of any type
Detached median
$732K
209 sales

By home type 12 months to November 3, 2026

TypeMedian soldAgainst North WestDays to sellA quarter sold under
Detached209 sales$732K13th highest of 20$19K below15North West: 21$630K
Townhouse26 sales$435K8th highest of 13About the same20North West: 30$410K
Apartment29 sales$430Kthe highest of 11$130K above37North West: 44$333K

University District

New community, still being built

922 homes, 100% of homes built since 2010, apartments from $334K.

What stands out

  • River valley pathways, 4 km of regional pathway
  • 1 school inside the community
  • Newest homes in the district: 100% built since 2010
  • Most shops and services in the district: 81 places
  • 1 playground, 1 childcare program
Entry price
$334K
lowest 25th-percentile sold price of any type
Apartment median
$410K
51 sales

By home type 12 months to November 3, 2026

TypeMedian soldAgainst North WestDays to sellA quarter sold under
Townhouse13 sales$670Kthe highest of 13$240K above46North West: 30$638K
Apartment51 sales$410K2nd highest of 11$110K above61North West: 44$334K

Ranchlands

Established community

2,472 homes, 100% of homes built before 2010, detached from $538K.

What stands out

  • 3 schools inside the community
  • 3 off-leash dog parks inside
  • Established streets: 0% built since 2010, grown-in yards
  • 12 playgrounds, 5 childcare programs
  • 16% of the land is park

Watch for

  • Little frequent transit
Entry price
$341K
lowest 25th-percentile sold price of any type
Detached median
$589K
46 sales

By home type 12 months to November 3, 2026

TypeMedian soldAgainst North WestDays to sellA quarter sold under
Detached46 sales$589K20th highest of 20$161K below17North West: 21$538K
Townhouse27 sales$350K13th highest of 13$80K below23North West: 30$341K

Silver Springs

Riverside community

3,250 homes, 99% of homes built before 2010, detached from $678K.

What stands out

  • Bow River valley pathways, 9 km of regional pathway
  • Melcor YMCA at Crowfoot inside
  • 3 schools inside the community
  • 6 off-leash dog parks inside
  • 13 playgrounds, 6 childcare programs

Watch for

  • 3% of lots back onto the busiest roads
  • Little frequent transit
Entry price
$358K
lowest 25th-percentile sold price of any type
Detached median
$790K
62 sales

By home type 12 months to November 3, 2026

TypeMedian soldAgainst North WestDays to sellA quarter sold under
Detached62 sales$790K10th highest of 20$40K above15North West: 21$678K
Townhouse16 sales$499K4th highest of 13$69K above42North West: 30$358K

Citadel

Established community

3,677 homes, 100% of homes built before 2010, detached from $599K.

What stands out

  • 3 schools inside the community
  • 11 playgrounds, 1 childcare program
  • 13% of the land is park
  • Mostly detached: 77% of homes
  • Nearest off-leash dog park: Hawkwood

Watch for

  • Little frequent transit
Entry price
$389K
lowest 25th-percentile sold price of any type
Detached median
$665K
96 sales

By home type 12 months to November 3, 2026

TypeMedian soldAgainst North WestDays to sellA quarter sold under
Detached96 sales$665K18th highest of 20$85K below22North West: 21$599K
Townhouse24 sales$412K9th highest of 13$18K below23North West: 30$389K

Scenic Acres

Riverside community

2,905 homes, 100% of homes built before 2010, detached from $672K.

What stands out

  • Bow River valley pathways, 7 km of regional pathway
  • Melcor YMCA at Crowfoot inside
  • 3 schools inside the community
  • 3 off-leash dog parks inside
  • Established streets: 0% built since 2010, grown-in yards
Mountain views, quick access to Crowchild and Stoney, and a resident lake in Arbour Lake.
My note
Entry price
$504K
lowest 25th-percentile sold price of any type
Detached median
$794K
71 sales

By home type 12 months to November 3, 2026

TypeMedian soldAgainst North WestDays to sellA quarter sold under
Detached71 sales$794K9th highest of 20$44K above21North West: 21$672K
Semi-detached15 sales$550K4th highest of 5$109K below24North West: 24$504K

Montgomery

Riverside community

1,654 homes, 33% of homes built since 2010, detached from $705K.

What stands out

  • Bow River valley pathways, 8 km of regional pathway
  • Shouldice Aquatic Centre inside
  • 2 schools inside the community
  • 2 off-leash dog parks inside
  • 8 playgrounds, 3 childcare programs

Watch for

  • 7% of lots back onto the busiest roads
Entry price
$550K
lowest 25th-percentile sold price of any type
Detached median
$770K
17 sales

By home type 12 months to November 3, 2026

TypeMedian soldAgainst North WestDays to sellA quarter sold under
Detached17 sales$770K11th highest of 20$20K above35North West: 21$705K
Semi-detached34 sales$847Kthe highest of 5$188K above28North West: 24$810K
Townhouse13 sales$573K2nd highest of 13$143K above57North West: 30$550K

Collingwood

Established community

828 homes, 95% of homes built before 2010, detached from $703K.

What stands out

  • Foothills Aquatic Centre inside
  • 3 schools inside the community
  • 2 off-leash dog parks inside
  • 4 playgrounds, 3 childcare programs
  • 19% of the land is park

Watch for

  • A thin resale record: 31 sales in the window
Entry price
$703K
lowest 25th-percentile sold price of any type
Detached median
$845K
27 sales

By home type 12 months to November 3, 2026

TypeMedian soldAgainst North WestDays to sellA quarter sold under
Detached27 sales$845K6th highest of 20$95K above12North West: 21$703K

Charleswood

Established community

1,316 homes, 96% of homes built before 2010, detached from $735K.

What stands out

  • Vecova Centre for Disability Services and Research inside
  • Most park space in the district: 31% of the land
  • 2 schools inside the community
  • 2 off-leash dog parks inside
  • 5 playgrounds, 2 childcare programs

Watch for

  • A thin resale record: 49 sales in the window
Entry price
$735K
lowest 25th-percentile sold price of any type
Detached median
$860K
49 sales

By home type 12 months to November 3, 2026

TypeMedian soldAgainst North WestDays to sellA quarter sold under
Detached49 sales$860K4th highest of 20$110K above14North West: 21$735K

Hamptons

Established community

2,541 homes, 97% of homes built before 2010, detached from $823K.

What stands out

  • 1 school inside the community
  • 2 playgrounds
  • Bungalows: 19% of detached sales were single-level
  • Mostly detached: 85% of homes
  • Nearest off-leash dog park: Hidden Valley
Entry price
$823K
lowest 25th-percentile sold price of any type
Detached median
$938K
59 sales

By home type 12 months to November 3, 2026

TypeMedian soldAgainst North WestDays to sellA quarter sold under
Detached59 sales$938K2nd highest of 20$188K above34North West: 21$823K

University Heights

Established community

496 homes, 97% of homes built before 2010, detached from $1.03M.

What stands out

  • Foothills Hospital inside the community
  • 2 schools inside the community
  • 1 playground, 1 childcare program
  • 13% of the land is park
  • Frequent bus routes cover 100% of the community

Watch for

  • A thin resale record: 14 sales in the window
Entry price
$1.03M
lowest 25th-percentile sold price of any type
Detached median
$1.29M
12 sales

By home type 12 months to November 3, 2026

TypeMedian soldAgainst North WestDays to sellA quarter sold under
Detached12 sales$1.29Mthe highest of 20$538K above4North West: 21$1.03M

Prices: MLS® sales, 12 months to November 3, 2026, shown at 10 or more sales. Parks, schools, playgrounds, childcare, recreation, libraries and off-leash areas: City of Calgary datasets. Shops and services: OpenStreetMap. New builds: builder listings on November 9, 2026. Lake and river: OpenStreetMap water inside or beside the community boundary.

Five of these carry a note from me. What homes cost, by type and by community, comes next.
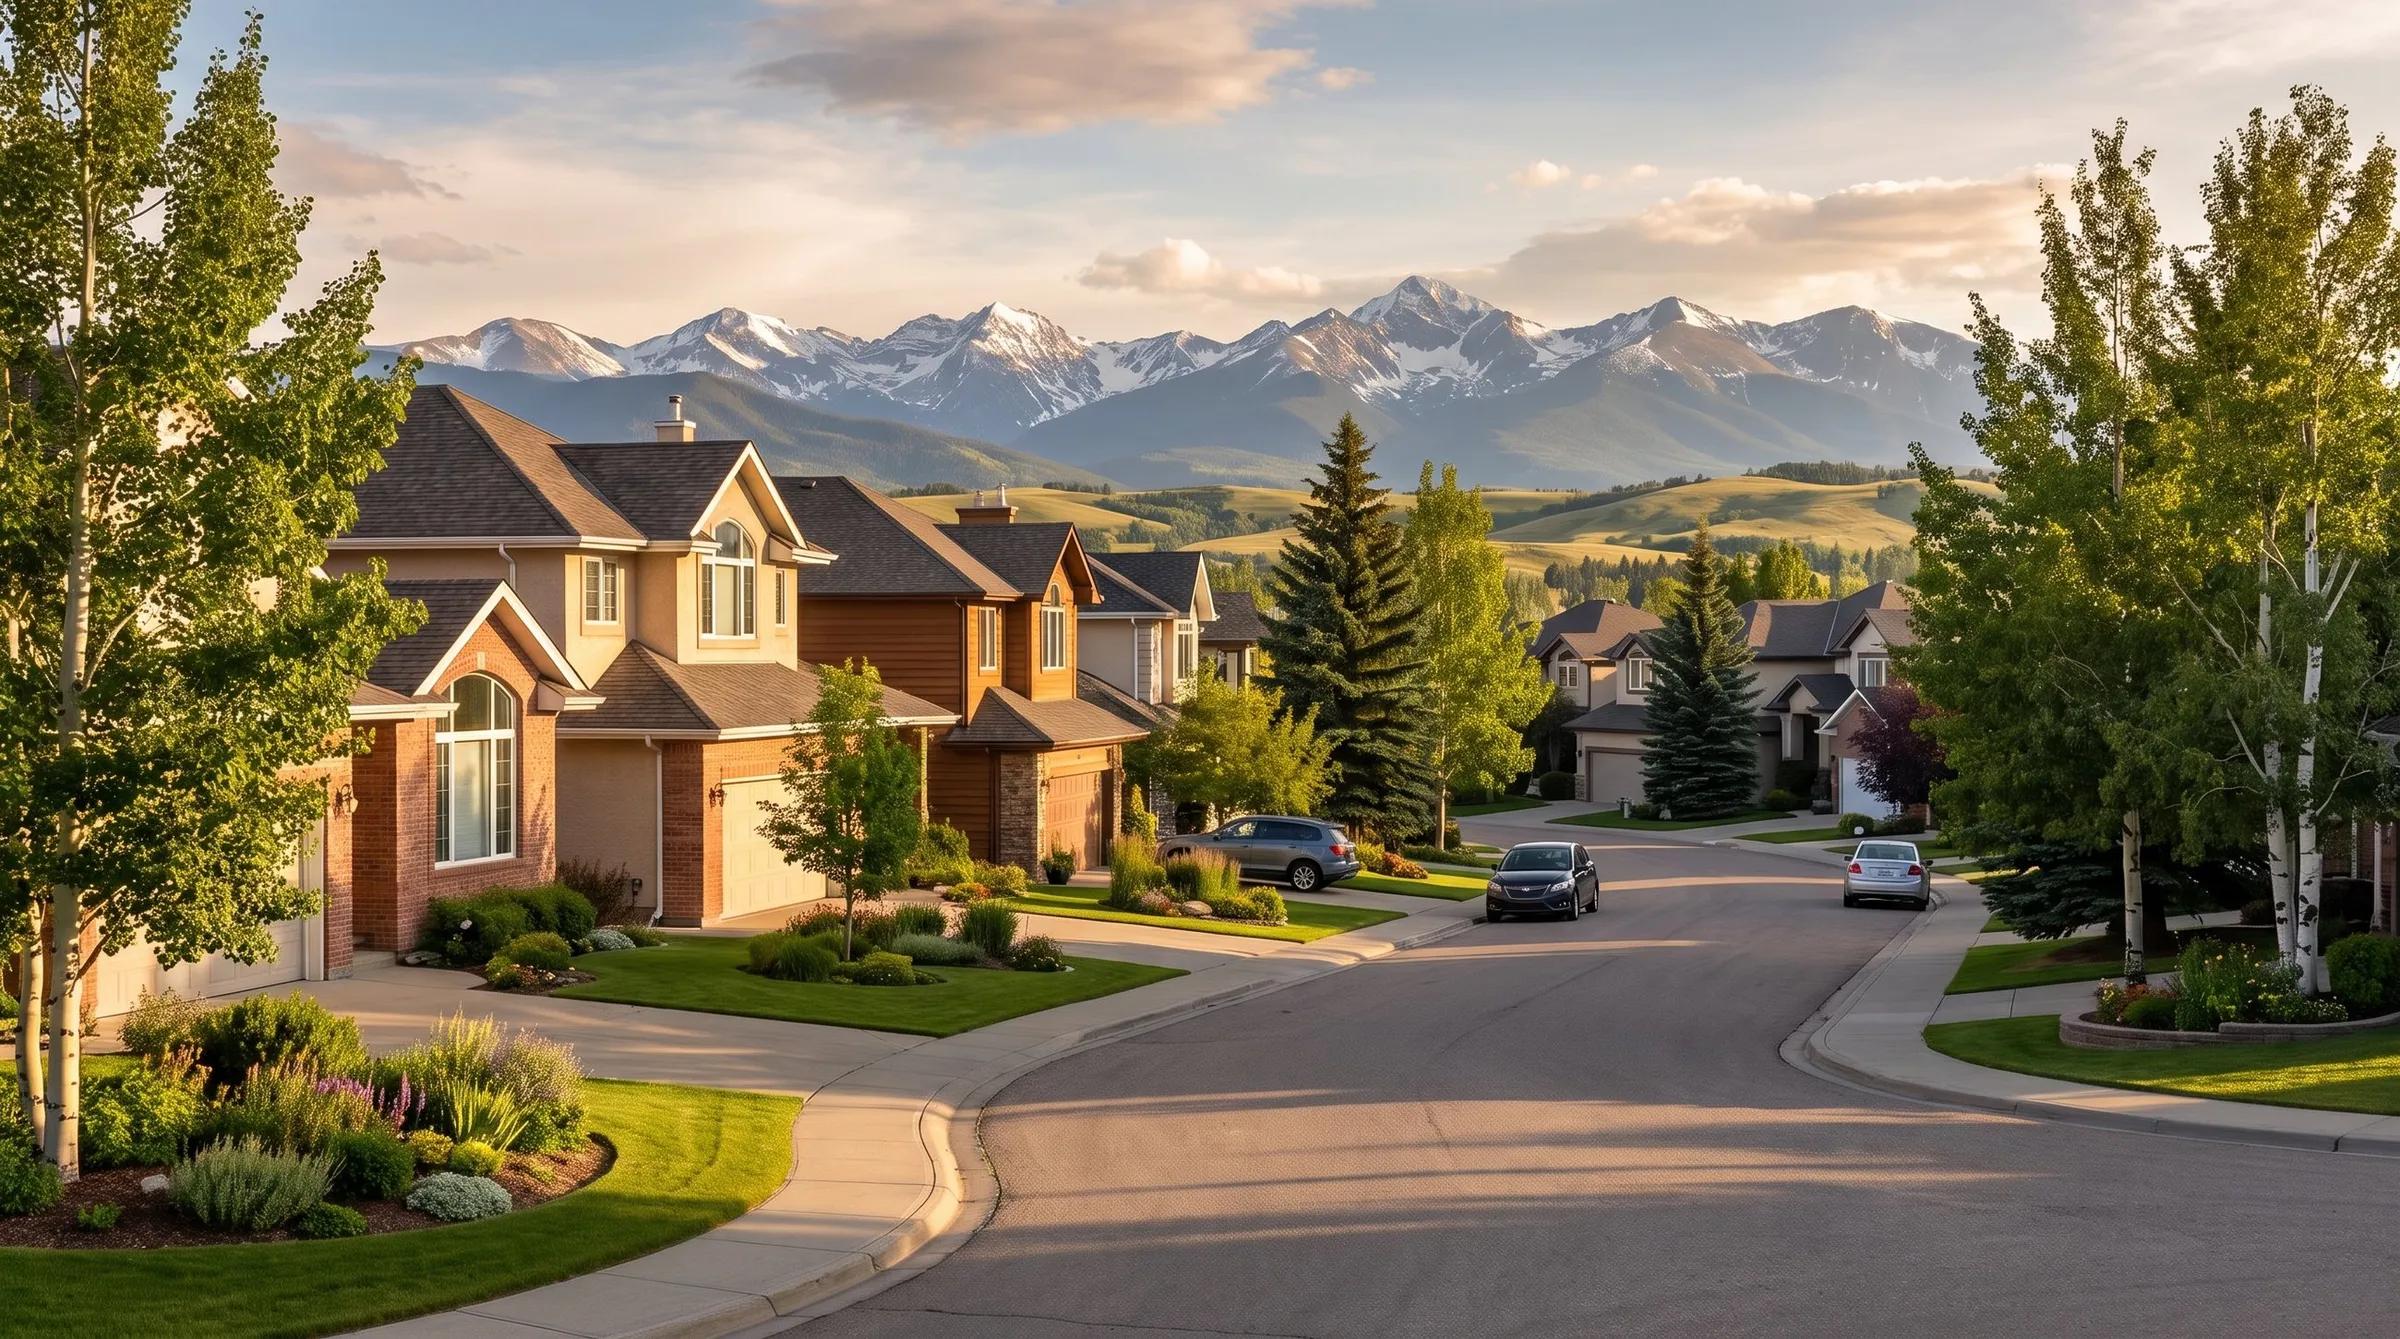
A curving residential street of large two-storey houses with landscaped yards and mature trees, mountains in the distance.

Prices

What do homes cost in North West Calgary?

Over the 12 months to November 3, 2026, a detached home in North West Calgary sold for a median of $750,000, 8% over the city's $695,000.

Pick a type. Every community is ranked by its median sold price over the 12 months to November 3, 2026, and the map shades the same figures.

TuscanyVarsityBownessEdgemontRoyal OakRocky RidgeArbour LakeDalhousieCitadelRanchlandsBrentwoodHawkwoodSilver SpringsScenic AcresMontgomeryHamptonsUniversity DistrictHaskayneCharleswoodCollingwoodGreenwood/GreenbriarUniversity Heights

Community medians run from $589K to $1.29M, darker is dearer. Detached sales: the middle 60% sold between $635K and $950K, the median at $750K, and the ends mark the 10th and 90th percentiles ($585K and $1.16M). Under 10 detached sales: not shaded.

Community medians run from $515K to $847K, darker is dearer. Semi-detached sales: the middle 60% sold between $504K and $851K, the median at $659K, and the ends mark the 10th and 90th percentiles ($478K and $929K). Under 10 semi-detached sales: not shaded.

Community medians run from $350K to $670K, darker is dearer. Townhouse sales: the middle 60% sold between $355K and $543K, the median at $430K, and the ends mark the 10th and 90th percentiles ($309K and $633K). Under 10 townhouse sales: not shaded.

Community medians run from $212K to $430K, darker is dearer. Apartment sales: the middle 60% sold between $230K and $401K, the median at $300K, and the ends mark the 10th and 90th percentiles ($200K and $498K). Under 10 apartment sales: not shaded.

Median detached sold price, shown at 10 or more sales. Darker is dearer.

MLS® sales, 12 months to November 3, 2026

Median semi-detached sold price, shown at 10 or more sales. Darker is dearer.

MLS® sales, 12 months to November 3, 2026

Median townhouse sold price, shown at 10 or more sales. Darker is dearer.

MLS® sales, 12 months to November 3, 2026

Median apartment sold price, shown at 10 or more sales. Darker is dearer.

MLS® sales, 12 months to November 3, 2026

Detached median sold price, highest first

Community medianAll of Calgary: $695K, 24 days to sell

Under 10 detached sales, not ranked: University District and Greenwood/Greenbriar.

Semi-detached median sold price, highest first

Community medianAll of Calgary: $585K, 28 days to sell

Under 10 semi-detached sales, not ranked: Tuscany, Varsity, Edgemont, Royal Oak, Arbour Lake, Citadel, Ranchlands, Brentwood, Hawkwood, Silver Springs, Hamptons, University District, Haskayne, Charleswood, Collingwood, Greenwood/Greenbriar and University Heights.

Townhouse median sold price, highest first

Community medianAll of Calgary: $418K, 32 days to sell

Under 10 townhouse sales, not ranked: Arbour Lake, Brentwood, Hawkwood, Scenic Acres, Hamptons, Charleswood, Collingwood, Greenwood/Greenbriar and University Heights.

Apartment median sold price, highest first

Community medianAll of Calgary: $295K, 39 days to sell

Under 10 apartment sales, not ranked: Bowness, Citadel, Ranchlands, Silver Springs, Scenic Acres, Montgomery, Hamptons, Haskayne, Charleswood, Collingwood and University Heights.

Detached, 12 months to November 3, 2026

Median $750KA quarter under $660KHalf sold within 21 daysPer square foot $448Sales 1,436

Sold with four or more bedrooms, the most common size
69%
The size that sells most often here, and its median price.
median $792K · 996 sales
Detached sales that were bungalows
26%
How much of what sold was single-level.
12 months to November 3, 2026 · 1,436 sales
Moving up to four or more bedrooms
$107K
A rough guide: bigger homes differ in more than bedrooms.
from three bedrooms, median to median · 404 and 996 sales

Semi-detached, 12 months to November 3, 2026

Median $659KA quarter under $520KHalf sold within 24 daysPer square foot $449Sales 194

Sold with four or more bedrooms, the most common size
52%
The size that sells most often here, and its median price.
median $783K · 101 sales
Semi-detached sales with a condo fee
24%
Most semis here carry no fee. Ask whether the one you like does.
median fee $466 / M · 47 sales
Moving up to four or more bedrooms
$165K
A rough guide: bigger homes differ in more than bedrooms.
from three bedrooms, median to median · 74 and 101 sales

Townhouse, 12 months to November 3, 2026

Median $430KA quarter under $370KHalf sold within 30 daysPer square foot $336Sales 307

Sold with three bedrooms, the most common size
53%
The size that sells most often here, and its median price.
median $435K · 164 sales
Townhouse condo fee, median , a month
$405
The median fee on townhouse sales that recorded one.
12 months to November 3, 2026 · 296 sales
Townhouse to detached, the step up
$316K
The gap between the median townhouse and the median detached home here, from the assessment roll.
City data, November 9, 2026 · homes-weighted median

Apartment, 12 months to November 3, 2026

Median $300KA quarter under $242KHalf sold within 44 daysPer square foot $362Sales 380

Sold with two bedrooms or fewer, the most common size
99%
The size that sells most often here, and its median price.
median $300K · 376 sales
Apartment condo fee, median , a month
$576
The median fee on apartment sales here.
12 months to November 3, 2026 · 380 sales
One size up
Not measured here
A rough guide: bigger homes differ in more than bedrooms.
12 months to November 3, 2026 · derived from the figures beside it

That's what it costs to get in. How hard buyers push, and when, is the next number.

Negotiation

How hard can you negotiate in North West Calgary?

Over the 12 months to November 3, 2026, half the detached homes in North West Calgary sold within 21 days, and 24% sold at or over the asking price.Source: MLS® sales, 12 months to November 3, 2026.

One row per type, 12 months to November 3, 2026. The bar under days to sell covers the middle half of sales, with the median marked. A cut compares the final list price with the original one.

The table scrolls sideways: four measures for each type.

Negotiation room by property type: days to sell, sellers who cut, typical cut, and sales at or over list
Property typeDays to sellmedian; bar is the middle halfSellers who cutshare of salesTypical cutmedian, where cutSold at or over listshare of sales
Detached1,436 sales21 daysmiddle half 11 to 44 days32%4%24%
Semi-detached194 sales24 daysmiddle half 14 to 56 days29%4.4%26%
Townhouse307 sales30 daysmiddle half 18 to 55 days36%3.7%15%
Apartment380 sales44 daysmiddle half 22 to 74 days41%5.4%11%

Darker cells leave a buyer more room to push, compared across the types here. Days axis 0 to 80.

Most room for a buyer: apartments on days to sell (44 days), apartments on sellers who cut (41%), apartments on the typical cut (5.4%) and apartments on sales at or over list (11%).

Buyer months and seller months

Every sale on record, January 2024 to November 2026, grouped by the month the home was listed and set against this district's own average month.

Homes listed in September and December closed furthest under asking, each at a median 98% of list price, and took a median 25 to 34 days to sell. Homes listed in March closed closest to asking, at a median 99.2% of list price, and took a median 15 days to sell.

Median sold price as a share of list price, by the month the home was listed, against the average month (98.6%)
Listed inAverage month 98.6%Sold at, % of listDays, medianSales
JanJanuary0.1 points further under asking than the average month98.5%19510
FebFebruary0.5 points closer to asking than the average month99.1%15588
MarMarch0.6 points closer to asking than the average month99.2%15736
AprApril0.5 points closer to asking than the average month99.1%14870
MayMay0.4 points closer to asking than the average month99.0%161,027
JunJune0.2 points closer to asking than the average month98.8%19882
JulJuly0.2 points further under asking than the average month98.4%20686
AugAugust0.4 points further under asking than the average month98.2%24574
SepSeptember0.6 points further under asking than the average month98.0%25591
OctOctober0.4 points further under asking than the average month98.2%24452
NovNovember0.4 points further under asking than the average month98.2%27269
DecDecember0.6 points further under asking than the average month98.0%34172
  • Left, navy: closed further under asking than the average month
  • Right, clay: closed closer to asking than the average month
TuscanyVarsityBownessEdgemontRoyal OakRocky RidgeArbour LakeDalhousieCitadelRanchlandsBrentwoodHawkwoodSilver SpringsScenic AcresMontgomeryHamptonsUniversity DistrictHaskayneCharleswoodCollingwoodGreenwood/GreenbriarUniversity Heights

Months of supply:

  • 1.6 mo to 2.1 mo
  • 2.1 mo to 3.4 mo
  • 3.4 mo to 4.7 mo
  • 4.7 mo to 8.8 mo
  • no figure: Ranchlands, Hamptons, University District, Collingwood, Greenwood/Greenbriar, University Heights

Days to sell, detached:

  • 4 days to 15 days
  • 15 days to 21 days
  • 21 days to 23 days
  • 23 days to 43 days
  • no figure: University District, Greenwood/Greenbriar

Benchmark, year over year:

  • -9% to -5%
  • -5% to 0
  • about 0
  • 0 to +5%
  • +5% to +9%

CREB® months of supply, all types. Darker means more listings per sale, which favours buyers.

CREB® October 2026

Half the detached homes sold within this many days, shown at 10 or more sales. Darker took longer, which leaves a buyer more room.

MLS® sales, 12 months to November 3, 2026

CREB® benchmark price change over a year. Navy shades fell, clay shades rose, and the lightest held about level.

CREB® October 2026

Months of supply, highest first

No CREB® figure: Ranchlands, Hamptons, University District, Collingwood, Greenwood/Greenbriar and University Heights.

Days to sell, detached, fastest first

Under 10 detached sales, not ranked: University District and Greenwood/Greenbriar.

Benchmark price change over a year, biggest rise first

Months of supply, all types
3.6 mo
Months to sell everything listed at the current pace. Lower favours sellers.
CREB® October 2026 · 182 sales · CREB® district figure
Benchmark price, year over year
-2%
CREB® benchmark for the district, October 2026 against October 2025.
CREB® October 2026 · CREB® district figure
Homes that sold in the year
3.7%
Share of all homes on the roll that changed hands.
City data, November 9, 2026 · homes-weighted median

Getting in is one number. Holding it, month after month, is a different one.

Cost to hold

What does it cost to own a home in North West Calgary, month to month?

Owning the median detached home in North West Calgary costs $4,190 a month in mortgage, property tax and any recorded condo fee, at 4.12% with the minimum down payment, before utilities.Source: my ownership model on MLS® sales, 12 months to November 3, 2026; Bank of Canada new-mortgage rates, August 2026.

Monthly cost to own the median home, by type

Mortgage, property tax and the recorded condo fee, at 4.12% over 25 years

Detached , a month
$4,190
On the median price with the minimum down payment, before utilities.
Income to qualify about $154,000
Semi-detached , a month
$4,080
On the median price with the minimum down payment, before utilities.
Income to qualify about $151,000
Townhouse , a month
$2,910
On the median price with the minimum down payment, before utilities.
Income to qualify about $99,000
Apartment , a month
$2,320
On the median price with the minimum down payment, before utilities.
Income to qualify about $71,000

$533 a month per $100,000 borrowed

Rate used: 4.12% with under 20% down (insured), 4.58% with 20% or more: what chartered banks actually charged on new 5-year fixed mortgages in August 2026 (Bank of Canada). Every cost here uses the minimum down payment, so the insured rate applies. Property tax at the 2026 City rate on the assessed value.

Condo fees by building age

Median monthly fee on apartment and townhouse resales, 12 months to November 3, 2026, grouped by the decade the building went up.

The highest is on buildings from before 2000, $555 a month. The lowest is on buildings from 2020 or later, $336. From 676 resales that recorded a fee.

  1. Before 2000 (287 resales): $555
  2. 2000s (206 resales): $462
  3. 2010s (93 resales): $490
  4. 2020 and newer (90 resales): $336
Two-bedroom rent , a month
$1,816
CMHC average, October 2025, weighted across the district. What staying a renter costs.
City data, November 9, 2026 · homes-weighted median
Own minus rent, two-bedroom apartment
$570
Monthly cost to own the median two-bedroom apartment, less the rent for one.
City data, November 9, 2026 · 233 sales · sales-weighted median
Gross yield, two-bedroom apartment
7.3%
Annual rent as a share of the median two-bedroom apartment price.
City data, November 9, 2026 · 233 sales · sales-weighted median
Gross yield, two-bedroom townhouse
5%
Annual rent as a share of the median two-bedroom townhouse price.
City data, November 9, 2026 · 48 sales · sales-weighted median
Approved secondary suites per 100 homes
4.5
Registered suites on the City list, per 100 homes.
City data, November 9, 2026 · homes-weighted average
Licensed short-term rentals per 1,000 homes
2.6
City licences per 1,000 homes.
City data, November 9, 2026 · homes-weighted median
Water main breaks per 100 homes, ten years
0.4
City records over ten years. Newer pipe breaks less.
City data, November 9, 2026 · homes-weighted average
Public trees that are mature
22%
Share of the City tree inventory here that is fully grown. Newer districts read low.
City data, November 9, 2026 · homes-weighted average
TuscanyVarsityBownessEdgemontRoyal OakRocky RidgeArbour LakeDalhousieCitadelRanchlandsBrentwoodHawkwoodSilver SpringsScenic AcresMontgomeryHamptonsUniversity DistrictHaskayneCharleswoodCollingwoodGreenwood/GreenbriarUniversity Heights

Monthly cost, detached:

  • $3,425 to $4,125
  • $4,125 to $4,353
  • $4,353 to $4,803
  • $4,803 to $7,135
  • no figure: University District, Greenwood/Greenbriar

Monthly cost, apartment:

  • $1,821 to $1,988
  • $1,988 to $2,320
  • $2,320 to $2,489
  • $2,489 to $3,155
  • no figure: Bowness, Citadel, Ranchlands, Silver Springs, Scenic Acres, Montgomery, Hamptons, Haskayne, Charleswood, Collingwood, University Heights

Townhouse condo fee:

  • $231 to $347
  • $347 to $391
  • $391 to $465
  • $465 to $600
  • no figure: Arbour Lake, Brentwood, Hawkwood, Scenic Acres, Hamptons, Charleswood, Collingwood, Greenwood/Greenbriar, University Heights

Apartment condo fee:

  • $388 to $455
  • $455 to $578
  • $578 to $643
  • $643 to $684
  • no figure: Bowness, Citadel, Ranchlands, Silver Springs, Scenic Acres, Montgomery, Hamptons, Haskayne, Charleswood, Collingwood, University Heights

Gross yield, 2-bed:

  • 4.4% to 6.9%
  • 6.9% to 7.3%
  • 7.3% to 10.2%
  • no figure: Bowness, Citadel, Ranchlands, Hawkwood, Silver Springs, Scenic Acres, Montgomery, Hamptons, Haskayne, Charleswood, Collingwood, Greenwood/Greenbriar, University Heights

Two-bedroom rent:

  • $1,708 to $1,816
  • $1,816 to $2,185

Mortgage, tax and fee on the median detached home at 4.12%, with the minimum down payment. Darker costs more a month.

Ownership model, Bank of Canada new-mortgage rates, August 2026

Mortgage, tax and fee on the median apartment at 4.12%, with the minimum down payment. Darker costs more a month.

Ownership model, Bank of Canada new-mortgage rates, August 2026

Median monthly condo fee on the townhouse resales that recorded one. Darker is higher.

MLS® sales, 12 months to November 3, 2026

Median monthly condo fee on apartment resales. Darker is higher.

MLS® sales, 12 months to November 3, 2026

Annual CMHC two-bedroom rent over the median two-bedroom price, before costs. Darker is higher.

CMHC rents, October 2025; MLS® sales

CMHC average two-bedroom rent, by tract or zone. Darker is dearer.

CMHC rents, October 2025

Monthly cost, detached, highest first

Too few detached sales: University District and Greenwood/Greenbriar.

Monthly cost, apartment, highest first

Too few apartment sales: Bowness, Citadel, Ranchlands, Silver Springs, Scenic Acres, Montgomery, Hamptons, Haskayne, Charleswood, Collingwood and University Heights.

Townhouse condo fee, highest first

Too few townhouse sales with a fee: Arbour Lake, Brentwood, Hawkwood, Scenic Acres, Hamptons, Charleswood, Collingwood, Greenwood/Greenbriar and University Heights.

Apartment condo fee, highest first

Too few apartment sales with a fee: Bowness, Citadel, Ranchlands, Silver Springs, Scenic Acres, Montgomery, Hamptons, Haskayne, Charleswood, Collingwood and University Heights.

Gross yield, 2-bed, highest first

Too few two-bedroom sales: Bowness, Citadel, Ranchlands, Hawkwood, Silver Springs, Scenic Acres, Montgomery, Hamptons, Haskayne, Charleswood, Collingwood, Greenwood/Greenbriar and University Heights.

Two-bedroom rent, highest first

Those are the carrying numbers. Daily life is what you're carrying them for.

Daily life

What is daily life like in North West?

68 schools and 202 City playgrounds sit inside North West, with 19.6 licensed childcare spaces for every 100 children under 15. City data, November 9, 2026.
TuscanyVarsityBownessEdgemontRoyal OakRocky RidgeArbour LakeDalhousieCitadelRanchlandsBrentwoodHawkwoodSilver SpringsScenic AcresMontgomeryHamptonsUniversity DistrictHaskayneCharleswoodCollingwoodGreenwood/GreenbriarUniversity Heights

68 schools inside North West, all boards and levels. A school shows under every level it teaches.

53 elementary schools inside North West. Hover one for its name.

25 schools teaching junior high inside North West. Hover one for its name.

16 schools teaching senior high inside North West. Hover one for its name.

187 parks of a hectare or more and 202 City playgrounds inside North West.

187 parks of a hectare or more inside North West.

202 City playgrounds inside North West.

16 recreation facilities and 3 public libraries inside North West. Hover one for its name.

16 recreation facilities inside North West. Hover one for its name.

3 public libraries inside North West. Hover one for its name.

  • Schools 68
  • Playgrounds 202
  • Recreation facilities 16
  • Libraries 3
  • Parks 187

City locations. Schools, recreation facilities and libraries show their names on hover.

City of Calgary open data: schools, November 1, 2026; playgrounds, November 8, 2026; recreation facilities, November 8, 2026; libraries, February 21, 2025; parks, November 5, 2026.

Schools inside the district
68
All boards and levels, City school locations.
City data, November 9, 2026 · district total
Childcare spaces per 100 children under 15
19.6
Licensed spaces against the children on record.
City data, November 9, 2026 · per child under 15
Playgrounds
202
City playground equipment sites.
1.2 per 1,000 residents · City data, November 9, 2026 · district total
Park space per 1,000 residents
9.8 ha
Hectares of City park per 1,000 residents.
City data, November 9, 2026 · per resident
Grocery stores
63
OpenStreetMap count inside the district.
City data, November 9, 2026 · district total
Restaurants
638
OpenStreetMap counts inside the district.
Also 168 cafes, 58 pharmacies, 44 gyms · City data, November 9, 2026 · district total

How North West feels

  • Established and elevated, literally and figuratively.
  • A calm suburban rhythm: bikes on the way to school, groceries nearby, sunsets out west.
  • Not flashy or trend-chasing. This is Calgary at its most dependable.
  • Wide roads, tidy yards and a sense that people take pride in their streets.

What locals say

“Our kids walk to school and the mountains are an hour away. It's everything we hoped Calgary would be.”

“Our tax bill is higher than friends' in other parts of the city, but it's worth it for the schools and the quiet.”

“Traffic can be annoying on Crowchild, but I'd never leave the NW.”

School attendance areas change; check the CBE and Catholic school finders for any address.

The households on record come next.

Households

Who lives in North West Calgary?

In the 2021 Census, 169,420 residents lived in North West Calgary, in 65,055 households, and 76% of households owned their home.Source: Statistics Canada 2021 Census, as the City of Calgary publishes it by community.
Residents
169,420
2021 Census, population in private households.
2021 Census · district total
Growth, 2014 to 2019
-1%
Population change between the City's 2014 and 2019 civic censuses, across the district.
City of Calgary civic census, 2014 to 2019 · population-weighted average
Households
65,055
2021 Census households.
2021 Census · district total
Residents under 15
16.7%
Share of residents aged 0 to 14.
2021 Census · population-weighted average

Household size

Share of households by number of people. Average 2.6.

  1. One person: 23%
  2. Two people: 34%
  3. Three people: 17%
  4. Four people: 18%
  5. Five or more: 9%

People in the household, 2021 Census

Owners

76% of households own their home. One square is one household in a hundred.

  • 76 of 100 own their home
  • 24 of 100 don't

2021 Census · household-weighted average

Couples with children at home
48%
Share of census families.
2021 Census · household-weighted average
One-parent families
13%
Share of census families.
2021 Census · household-weighted average
Commute by transit
8%
Share of commuters, 2021 Census.
2021 Census · population-weighted average
Commute of 30 minutes or more
33%
Share of commuters, 2021 Census.
2021 Census · population-weighted average
TuscanyVarsityBownessEdgemontRoyal OakRocky RidgeArbour LakeDalhousieCitadelRanchlandsBrentwoodHawkwoodSilver SpringsScenic AcresMontgomeryHamptonsUniversity DistrictHaskayneCharleswoodCollingwoodGreenwood/GreenbriarUniversity Heights

Homes built since 2010:

  • 0% to 1%
  • 1% to 4%
  • 4% to 13%
  • 13% to 100%

Mature public trees:

  • 0% to 9%
  • 9% to 24%
  • 24% to 35%
  • 35% to 50%

Share of homes on the assessment roll built in 2010 or later. Darker is newer.

City of Calgary 2026 assessment roll

Share of the City's public trees here that are fully grown. Newer streets read low. Darker is more.

City of Calgary tree inventory

Homes built since 2010, newest first

Mature public trees, highest first

Now the part of the file that buyers skip and lawyers don't.

Before you offer

What should you check before you offer in North West?

City of Calgary maps put 0.7% of North West's 50,794 residential lots in the 1:100 flood zone and none inside the NEF 25 aircraft noise band, as of November 9, 2026.
TuscanyVarsityBownessEdgemontRoyal OakRocky RidgeArbour LakeDalhousieCitadelRanchlandsBrentwoodHawkwoodSilver SpringsScenic AcresMontgomeryHamptonsUniversity DistrictHaskayneCharleswoodCollingwoodGreenwood/GreenbriarUniversity Heights
  • Floodway
  • Flood fringe
  • Freight rail
  • Busiest roads (2024 counts)

The City's own hazard maps. Hover a busy road for its 2024 count.

City of Calgary: regulatory flood map, September 3, 2026; noise exposure forecast contours, October 1, 2026; non-LRT tracks, October 1, 2026; 2024 traffic volumes, August 5, 2025.

Each tile is the share of the district's residential lots that one City hazard layer touches. I name a community when 10% or more of its lots sit in the flood zone, 20% or more inside the noise band or beside freight rail, or 5% or more beside one of the busiest roads.

Lots in the 1:100 flood zone
0.7%
At 10% of lots or more: Bowness (11.3%) · 50,794 lots
Lots in the floodway
0%
50,794 lots
Lots inside the NEF 25 noise band
0%
No community at 20% of lots or more · 50,794 lots
Lots beside the busiest roads
1.7%
At 5% of lots or more: Montgomery (7.4%) · 50,794 lots
Lots beside freight rail
1.5%
At 20% of lots or more: Bowness (21.5%) · 50,794 lots
Lots inside a landfill setback
0%
50,794 lots

Share of residential lots · City data, November 9, 2026

Weather and the outdoors

Elevation

Some of the highest ground in the city, so it tends to run colder with more snow than the South East or East.

Wind exposure

Open hilltops bring wind chill and drifting snow in places like Tuscany and Rocky Ridge.

Natural integration

Nose Hill Park, ravines and river trails make this one of the most nature-connected districts.

Hail

Part of Calgary's hail corridor, like every district. Ask for roof age on any resale.

Buying in the North West, your winter might feel a couple of weeks longer than a friend's in the South East. It's beautiful, and shovelling is part of the lifestyle.

Four things I check on your behalf here

  1. Check the age of the systems

    Much of the district was built in the 1970s and 1980s. Ask for the age of the furnace, roof, windows and the electrical panel.

  2. Bowness sits by the river

    Part of Bowness is in the 1-in-100 flood area. If you are looking there, check the lot and get an insurance quote early.

  3. Hillside lots need a closer look

    Ridge and walkout lots bring retaining walls, drainage and grading. Ask the inspector to look at all three.

  4. Confirm the school, not the reputation

    Designations change with enrolment. Check the exact address with the board before you write.

What's being built next door changes all of this over time.

What's coming

What is coming to North West Calgary?

The City permitted 2,861 housing units in North West Calgary in the 24 months to November 6, 2026, and builders were advertising 136 new homes here on November 9, 2026 (City of Calgary building permits; builders' public listings).
TuscanyVarsityBownessEdgemontRoyal OakRocky RidgeArbour LakeDalhousieCitadelRanchlandsBrentwoodHawkwoodSilver SpringsScenic AcresMontgomeryHamptonsUniversity DistrictHaskayneCharleswoodCollingwoodGreenwood/GreenbriarUniversity HeightsUniversity District: 96 new-build listings96Haskayne: 38 new-build listings38Greenwood/Greenbriar: 2 new-build listings

Units permitted, 24 months:

  • 0 to 1
  • 1 to 6
  • 6 to 30
  • 30 to 649

New-build listings:

  • 0 to 96

Units planned:

  • 1,733 to 4,265
  • no figure: Tuscany, Varsity, Bowness, Edgemont, Royal Oak, Rocky Ridge, Arbour Lake, Dalhousie, Citadel, Ranchlands, Brentwood, Hawkwood, Silver Springs, Scenic Acres, Montgomery, Hamptons, University District, Charleswood, Collingwood, University Heights

Key:

  • New-build listings, circle size is the count
  • Regional pathways

Housing units the City permitted in two years. Darker is more.

City of Calgary building permits, 24 months to November 6, 2026

Homes builders were advertising in the community on the date shown. Darker is more.

builders' public listings, November 9, 2026

Units in approved outline plans and area structure plans, on land not yet built. Darker is more.

City of Calgary, November 9, 2026

Units permitted, 24 months, highest first

New homes builders are advertising, most first

Units planned, highest first

None on record: Tuscany, Varsity, Bowness, Edgemont, Royal Oak, Rocky Ridge, Arbour Lake, Dalhousie, Citadel, Ranchlands, Brentwood, Hawkwood, Silver Springs, Scenic Acres, Montgomery, Hamptons, University District, Charleswood, Collingwood and University Heights.

Housing units permitted, 24 months
2,861
New homes the City approved here in two years.
City data, November 9, 2026 · district total
Units planned on land not yet built
5,998
Approved outline plans and area structure plans, City of Calgary.
City data, November 9, 2026 · district total
New-build listings live
136
Homes builders were advertising in the district on the date shown.
6 builders active · builders' listings, November 9, 2026
Builder price cuts, 8 weeks
58
Builder listings whose asking price fell in the last eight weeks.
builders' listings, November 9, 2026 · district total
Development permit applications, 24 months
396
Residential development permits applied for.
City data, November 9, 2026 · district total
Land-use redesignation applications, 24 months
26
Rezoning applications in the district.
City data, November 9, 2026 · district total

Most new-build listings: University District (96) and Haskayne (38), in builders' listings, November 9, 2026.

The 6 builders advertising here: Brookfield, Cedarglen, Crystal Creek, Homes by Avi, Jayman and Rohit.

What I expect to change

  • Built outMost North West communities are fully built, especially the inner NW like Brentwood and Varsity.
  • InfillSome infill closer to downtown, in Banff Trail and Montgomery.
  • Transit densityStrongest near Crowfoot and Tuscany stations, lighter in the hilltop and outer suburbs.
  • Rate of changeSlow by design. The big new builds are University District and the far north-west edge.

What you see is mostly what you'll get in the North West, and for many buyers that predictability is the appeal.

If you'd rather see it than read it, the tour is next.

Snow-covered rolling hills above a valley, with bare shrubs in the foreground.

Is it for you

Is North West right for you?

  • You want established schools and resale value

    Settled communities with stable values.

  • You love parks, trails and mountain weekends

    Nose Hill close by, Highway 1 not far.

  • You're fine with a slightly longer commute

    In exchange for long-term stability.

  • You prefer a settled suburban life

    Established streets and amenities.

The North West is built for buyers who want to put down roots. If you want long-term value and a view with your morning coffee, it might be your place.

North West · 22 residential communities · 62,986 homes

See it before you visit

Hidden Gems & Best Communities in Calgary: the full guide. My walkthrough of every Calgary region; it loads from YouTube when you press play.

Watch the market updates

Still have questions?

Is there something you'd like to know?

I'd be happy to help. Tell me your budget and the communities you circled in North West, and I'll show you what actually sold there.

Book a call(opens in a new tab)Read testimonials

Sources

MLS® sales, 12 months to November 3, 2026 · CREB® October 2026 · builders' public listings, November 9, 2026 · City of Calgary open data · OpenStreetMap · CMHC · Bank of Canada, August 2026 · 2021 Census. No median under 10 sales. Photographs are illustrations.

How each figure is built
  • Sales. Medians and price curves: MLS® sales in Ash Iyer's archive, 12 months to November 3, 2026. Price per square foot uses the listing's recorded floor area. Negotiation figures cover the same window; the monthly pattern uses every sale on record for this district, grouped by listing month (close date minus days on market).
  • CREB®. Months of supply and benchmark change: CREB® district statistics for October 2026. Source: CREB®.
  • New construction. New builds: homes advertised in builders' public listings, November 9, 2026.
  • Getting around. Drive times: OpenStreetMap routing from each community's centre, no traffic model, so treat them as a floor. Transit, bikeways, pathways and snow routes: City of Calgary. CTrain: a station within 1.2 km, straight line.
  • Ownership costs. Monthly cost to own: Ash Iyer's ownership-cost model at the minimum down payment, with the rate chartered banks actually charged on new 5-year fixed mortgages in August 2026 (Bank of Canada: 4.12% insured, under 20% down; 4.58% uninsured), 25-year amortisation, 2026 tax rate and the recorded condo fee. Rents: CMHC, October 2025. Suites and short-term rentals: City of Calgary.
  • Housing stock. Homes, construction era, turnover and the move-up step: City of Calgary 2026 assessment roll (valued July 1, 2025) and MLS® sales.
  • Supply pipeline. Building permits, development permits, land-use redesignations and planned units: City of Calgary open data, Oct 2026; 24 months to 2026-11-06.
  • Schools family. City of Calgary school, childcare, playground, recreation, library, parks and health datasets. Amenity counts: OpenStreetMap.
  • Risk diligence. Flood, aircraft noise, busy roads, rail and landfill setbacks: City of Calgary open data (1:100 flood map 2023, NEF contours, 2024 traffic volumes). Water main breaks: City of Calgary, ten years.
  • People. 2021 Census by community and the City's civic census (City of Calgary open data). Descriptive only: this describes the households and housing on record, not who should live here.
  • Roll-ups. median of communities: median across the district's residential communities (200 or more homes), commute minutes rounded up; sales-weighted median: median across the district's community and property-type records, weighted by sales; homes-weighted median: median across the district's communities, weighted by homes; homes-weighted average: average across the district's communities, weighted by homes; household-weighted average: average across the district's communities, weighted by households; population-weighted average: average across the district's communities, weighted by residents; area-weighted average: average across the district's communities, weighted by land area; share of residential lots: share of all residential lots in the district's communities; share of homes: share of all homes in the district's communities; district total: total across the district's communities; per resident: total across the district's communities, per resident; per child under 15: total across the district's communities, per child under 15; CREB® district figure: CREB® district figure, as published; derived from the figures beside it: derived from the figures beside it.
  • Floors. No median is shown under 10 sales; no listing month under 15 sales. Figures refresh when the sales archive or the weekly data run updates, and every date on this page is read from the data.
  • Map. City of Calgary community boundaries (Open Data Terms of Use), grouped by CREB district; OpenStreetMap water bodies via Overpass (ODbL), fetched 2026-11-12 (cached copy).
  • Photographs. Illustrations of the district, not photographs of a specific street or home.