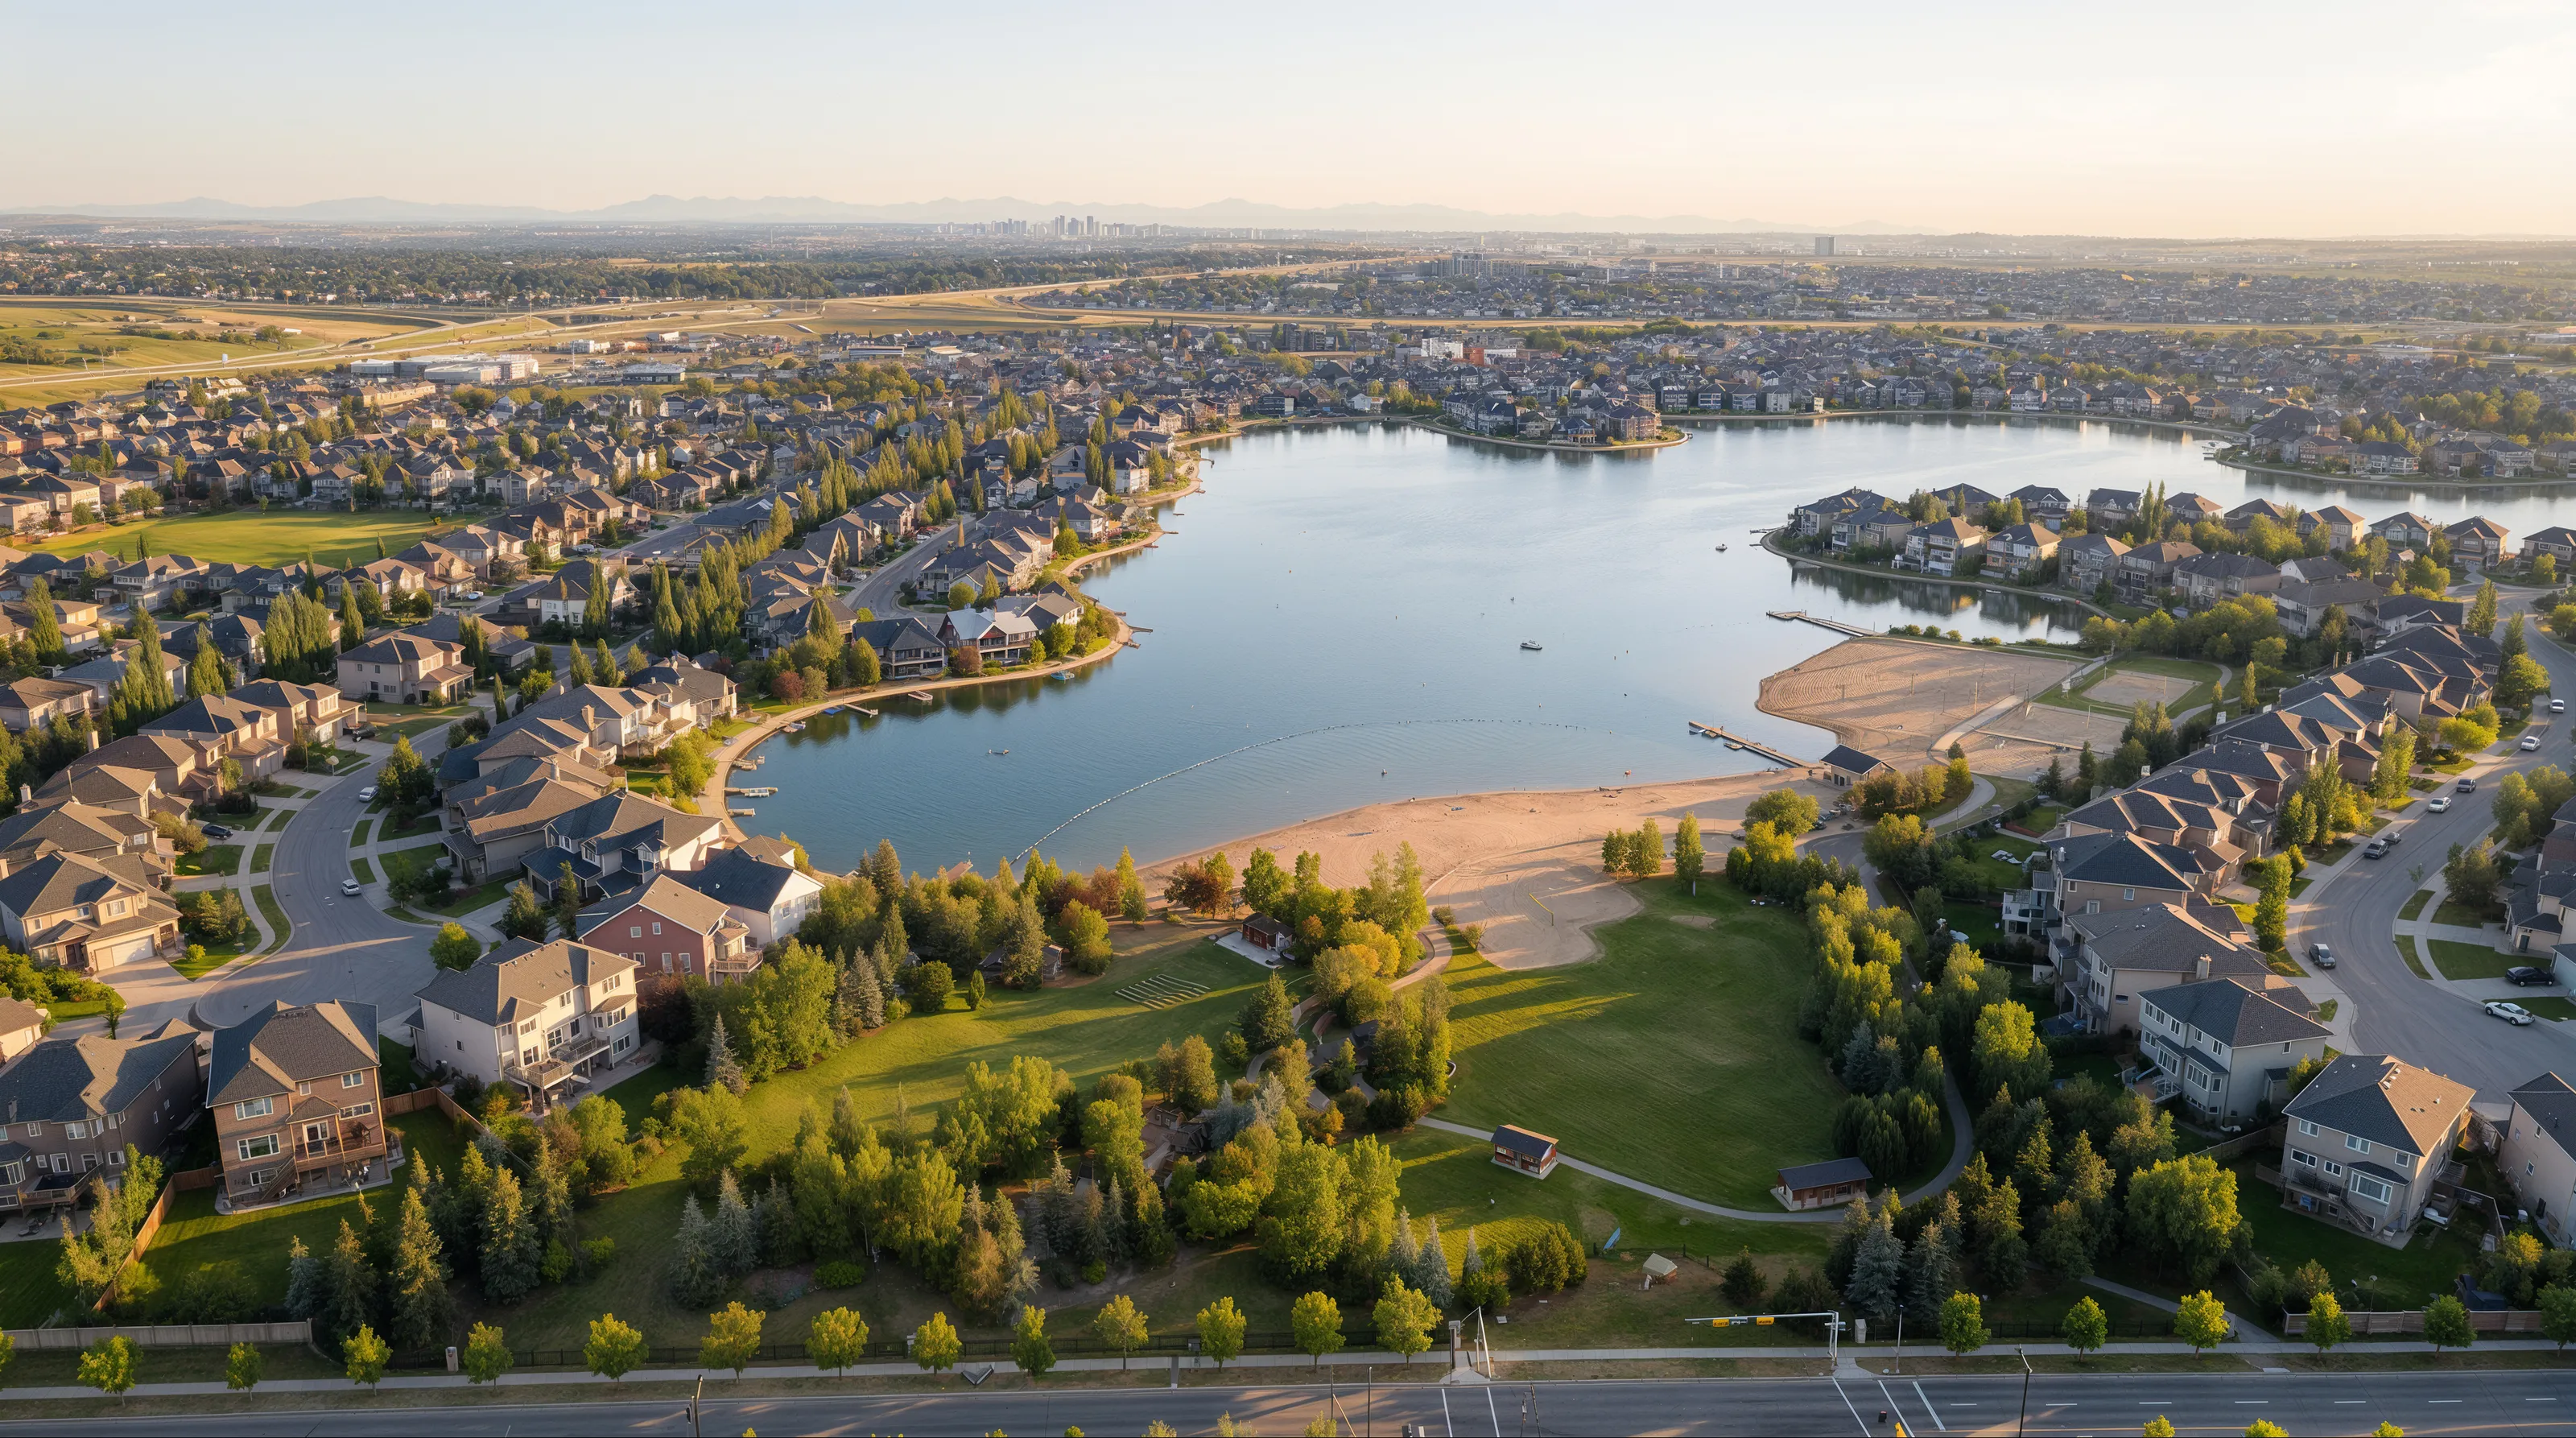
South East Calgary

New builds, active living and lake communities

Detached median
$656K
Half of detached sales closed above this, half below.
Apartment median
$305K
Half of apartment sales closed above this, half below.
Drive to downtown
26 min
Routed with no traffic, so treat it as a floor.
Homes built since 2010
49%
How much of the housing here is under 16 years old.

Sales to November 3, 2026 (last export 17 days ago)CREB® October 2026

The read

What is true about South East right now?

Over the 12 months to November 3, 2026, a detached home in South East Calgary sold for a median of $656,000, 6% under the city's $695,000, and an apartment for $305,000. Half the detached homes here sold within 25 days. 49% of the district's homes were built since 2010, and the median drive to downtown is 26 minutes with no traffic.

That's the district in one paragraph. Where it sits, and what the location costs in minutes, comes first.

My read

If you're moving to Calgary and want a newer home, lake access and modern amenities, South East Calgary was practically built for you.

Where it sits

Where is South East Calgary, and what does the location cost in minutes?

The median drive to downtown from a South East Calgary community is 26 minutes with no traffic, from 16 minutes for the closest to 31 for the farthest (OpenStreetMap routing; City data, November 9, 2026).
Drive to downtown, median
26 min
Routed with no traffic, so treat it as a floor.
Walk to the nearest transit stop
4 min
Median across communities, to any stop.
Near a frequent bus route
41%
Share of the district within reach of a route that runs every 15 minutes or better.
Communities near a CTrain station
0of 14
Within 1.2 km of a station, straight line. Open circles mark the planned Green Line stations.
CranstonMahoganyMcKenzie TowneAuburn BayCopperfieldSetonNew BrightonDouglasdale/GlenMcKenzie LakeRiverbendOgdenRangeviewHotchkissRicardo RanchShepard IndustrialSouth Foothills

Key:

  • South East
  • Every ten minutes of driving
  • Hub
  • Driving route
  • Transit stop
  • Frequent route and its stops
  • Green Line station, planned

Each ring is ten minutes of driving from the district's centre. Median drive with no traffic: South Health 9 min, Quarry Park 14 min, Downtown 26 min, YYC 33 min and U of C 34 min. Tap a figure above the map to show it.

OpenStreetMap routing, no traffic. Calgary Transit GTFS. City data, November 9, 2026.

Drive to downtown, shortest first

Near a frequent bus route, highest first

Walk to a transit stop, shortest first

Getting around, from someone who lives here

No CTrain yet. The Green Line's first phase ends at Shepard, and the stations planned nearer these communities have no funded stage. Express buses run downtown, and Stoney Trail and Deerfoot give quick car access across the city.

Errands. Very efficient. Seton puts a hospital, the YMCA, groceries and restaurants within a few blocks.

If your day-to-day matters more than the morning commute, this is one of Calgary's most self-contained districts.

The communities inside it are where the decision gets made.

Communities

Which South East communities should you look at, and why?

14 communities, each read from the record: what kind of place it is, what its homes sell for, where it ranks and what to watch for.
CranstonMahoganyMcKenzie TowneAuburn BayCopperfieldSetonNew BrightonDouglasdale/GlenMcKenzie LakeRiverbendOgdenRangeviewHotchkissRicardo RanchShepard IndustrialSouth Foothills
  • The district's urban core
  • Lake community
  • Riverside community
  • New community, still being built
  • Established community
  • Community

Kinds of place here come from a lake inside the community, the Bow River valley, the hospital and library in Seton, how much was built since 2010 and how much is still being built. Pick a community on the map to open its profile below.

City boundaries, OpenStreetMap water, 2026 assessment roll, City facilities.

In order of entry price, lowest first.

1 of 14

Copperfield

Community

5,391 homes, 54% of homes built since 2010, detached from $540K.

What stands out

  • 2 schools inside the community
  • Among the lowest entry prices in the district: from $238K
  • 13 playgrounds, 4 childcare programs
  • Frequent bus routes cover 95% of the community
  • 22 ha of natural area
Established SE communities, with McKenzie Towne's High Street and lower detached prices than the lake communities.
My note
Entry price
$238K
lowest 25th-percentile sold price of any type
Detached median
$595K
147 sales

By home type 12 months to November 3, 2026

TypeMedian soldAgainst South EastDays to sellA quarter sold under
Detached147 sales$595K13th highest of 14$61K below28South East: 25$540K
Townhouse70 sales$390K9th highest of 12$20K below28South East: 35$370K
Apartment56 sales$263K7th highest of 7$42K below30South East: 37$238K

McKenzie Towne

Established community

7,154 homes, 85% of homes built before 2010, detached from $546K.

What stands out

  • 3 schools inside the community
  • Among the lowest entry prices in the district: from $242K
  • Most shops and services in the district: 79 places
  • 17 playgrounds, 8 childcare programs
  • 14% of the land is park

Watch for

  • The Green Line station has no funded stage
  • 3% of lots back onto the busiest roads
Established SE communities, with McKenzie Towne's High Street and lower detached prices than the lake communities.
My note
Entry price
$242K
lowest 25th-percentile sold price of any type
Detached median
$614K
156 sales

By home type 12 months to November 3, 2026

TypeMedian soldAgainst South EastDays to sellA quarter sold under
Detached156 sales$614K11th highest of 14$42K below20South East: 25$546K
Semi-detached27 sales$480K8th highest of 9$50K below22South East: 31$458K
Townhouse84 sales$395K8th highest of 12$15K below35South East: 35$350K
Apartment77 sales$268K6th highest of 7$38K below32South East: 37$242K

Auburn Bay

Lake community

6,340 homes, 74% of homes built since 2010, detached from $611K.

What stands out

  • Auburn Bay Lake inside the community
  • 5 schools inside the community
  • 1 off-leash dog park inside
  • Among the lowest entry prices in the district: from $257K
  • 12 playgrounds, 7 childcare programs

Watch for

  • Check title for a lake association fee
  • The Green Line station has no funded stage
Calgary's newer lake communities, with resident beach clubs and year-round recreation.
My note
Entry price
$257K
lowest 25th-percentile sold price of any type
Detached median
$749K
166 sales

By home type 12 months to November 3, 2026

TypeMedian soldAgainst South EastDays to sellA quarter sold under
Detached166 sales$749K2nd highest of 14$93K above22South East: 25$611K
Semi-detached39 sales$530K4th highest of 9About the same23South East: 31$520K
Townhouse56 sales$383K11th highest of 12$27K below38South East: 35$349K
Apartment57 sales$305K5th highest of 7About the same34South East: 37$257K

Seton

The district's urban core

4,108 homes, 100% of homes built since 2010, detached from $639K.

What stands out

  • South Health Campus inside the community
  • Brookfield Residential YMCA at Seton inside
  • 1 school inside the community
  • Newest homes in the district: 100% built since 2010
  • Seton Library inside

Watch for

  • The Green Line station has no funded stage
  • Construction for years to come: 4,414 units planned
An urban-style core with the South Health Campus, major retail and the Brookfield Residential YMCA, reported as the largest YMCA in the world.
My note
Entry price
$273K
lowest 25th-percentile sold price of any type
Detached median
$705K
57 sales

By home type 12 months to November 3, 2026

TypeMedian soldAgainst South EastDays to sellA quarter sold under
Detached57 sales$705K5th highest of 14$49K above38South East: 25$639K
Semi-detached35 sales$580K3rd highest of 9$50K above38South East: 31$534K
Townhouse85 sales$414K7th highest of 12About the same35South East: 35$369K
Apartment87 sales$327K3rd highest of 7$22K above43South East: 37$273K

Mahogany

Lake community

7,219 homes, 98% of homes built since 2010, detached from $640K.

What stands out

  • Mahogany Lake inside the community
  • 2 schools inside the community
  • 13 playgrounds, 7 childcare programs
  • 25 ha of natural area
  • Bigger detached homes: 63% of detached sales had four or more bedrooms

Watch for

  • Check title for a lake association fee
  • The Green Line station has no funded stage
  • Among the highest apartment condo fees in the district ($555 a month on the median resale)
Calgary's newer lake communities, with resident beach clubs and year-round recreation.
My note
Entry price
$284K
lowest 25th-percentile sold price of any type
Detached median
$760K
240 sales

By home type 12 months to November 3, 2026

TypeMedian soldAgainst South EastDays to sellA quarter sold under
Detached240 sales$760Kthe highest of 14$104K above27South East: 25$640K
Semi-detached52 sales$585Ktied for the highest of 9$55K above30South East: 31$563K
Townhouse47 sales$505K2nd highest of 12$95K above48South East: 35$412K
Apartment84 sales$363K2nd highest of 7$58K above43South East: 37$284K

Cranston

Riverside community

8,167 homes, 55% of homes built since 2010, detached from $594K.

What stands out

  • Bow River valley pathways, 16 km of regional pathway
  • Most park space in the district: 26% of the land
  • 5 schools inside the community
  • 20 playgrounds, 7 childcare programs
  • Frequent bus routes cover 57% of the community

Watch for

  • Among the highest apartment condo fees in the district ($543 a month on the median resale)
  • 13% of lots sit in the regulatory flood zone
Established and new homes with Bow River pathway access.
My note
Entry price
$284K
lowest 25th-percentile sold price of any type
Detached median
$725K
234 sales

By home type 12 months to November 3, 2026

TypeMedian soldAgainst South EastDays to sellA quarter sold under
Detached234 sales$725K3rd highest of 14$69K above24South East: 25$594K
Semi-detached25 sales$493K6th highest of 9$38K below15South East: 31$480K
Townhouse75 sales$415K6th highest of 12$5K above30South East: 35$369K
Apartment58 sales$307K4th highest of 7About the same35South East: 37$284K

McKenzie Lake

Lake community

4,581 homes, 100% of homes built before 2010, detached from $549K.

What stands out

  • McKenzie Lake inside the community
  • Bow River valley pathways, 9 km of regional pathway
  • 3 schools inside the community
  • Established streets: 0% built since 2010, mature trees
  • 15 playgrounds, 4 childcare programs

Watch for

  • Check title for a lake association fee
  • 4% of lots back onto the busiest roads
  • Little frequent transit
Entry price
$362K
lowest 25th-percentile sold price of any type
Detached median
$715K
140 sales

By home type 12 months to November 3, 2026

TypeMedian soldAgainst South EastDays to sellA quarter sold under
Detached140 sales$715K4th highest of 14$59K above15South East: 25$549K
Townhouse11 sales$384K10th highest of 12$26K below36South East: 35$362K

New Brighton

Community

4,368 homes, 44% of homes built since 2010, detached from $561K.

What stands out

  • Brookfield Residential YMCA at Seton inside
  • 3 schools inside the community
  • Most shops and services in the district: 41 places
  • 10 playgrounds, 5 childcare programs
  • 14% of the land is park

Watch for

  • The Green Line station has no funded stage
Entry price
$369K
lowest 25th-percentile sold price of any type
Detached median
$620K
110 sales

By home type 12 months to November 3, 2026

TypeMedian soldAgainst South EastDays to sellA quarter sold under
Detached110 sales$620K9th highest of 14$36K below22South East: 25$561K
Townhouse53 sales$380K12th highest of 12$30K below29South East: 35$369K

Ogden

Riverside community

2,851 homes, 98% of homes built before 2010, detached from $460K.

What stands out

  • Bow River valley pathways, 6 km of regional pathway
  • Remington YMCA in Quarry Park inside
  • Most park space in the district: 28% of the land
  • 4 schools inside the community
  • 4 off-leash dog parks inside

Watch for

  • 4% of lots back onto the busiest roads
  • 7% of lots sit beside freight rail
Entry price
$385K
lowest 25th-percentile sold price of any type
Detached median
$515K
73 sales

By home type 12 months to November 3, 2026

TypeMedian soldAgainst South EastDays to sellA quarter sold under
Detached73 sales$515K14th highest of 14$141K below25South East: 25$460K
Semi-detached21 sales$410K9th highest of 9$120K below31South East: 31$385K

Douglasdale/Glen

Riverside community

4,887 homes, 82% of homes built before 2010, detached from $638K.

What stands out

  • Bow River valley pathways, 11 km of regional pathway
  • Remington YMCA in Quarry Park inside
  • 2 schools inside the community
  • Most shops and services in the district: 54 places
  • Quarry Park Library inside

Watch for

  • Among the highest apartment condo fees in the district ($659 a month on the median resale)
  • 14% of lots sit in the regulatory flood zone
  • 6% of lots back onto the busiest roads
Entry price
$443K
lowest 25th-percentile sold price of any type
Detached median
$693K
138 sales

By home type 12 months to November 3, 2026

TypeMedian soldAgainst South EastDays to sellA quarter sold under
Detached138 sales$693K6th highest of 14$37K above16South East: 25$638K
Semi-detached11 sales$585Ktied for the highest of 9$55K above22South East: 31$549K
Townhouse24 sales$554Kthe highest of 12$144K above36South East: 35$507K
Apartment30 sales$480Kthe highest of 7$175K above54South East: 37$443K

Rangeview

New community, still being built

1,353 homes, 100% of homes built since 2010, detached from $577K.

What stands out

  • Newest homes in the district: 100% built since 2010
  • 3 playgrounds
  • Homes come up often: 11.0% traded in the year
  • No school inside the community
  • Mostly detached: 71% of homes

Watch for

  • Construction for years to come: 9,851 units planned
  • Little frequent transit
Entry price
$449K
lowest 25th-percentile sold price of any type
Detached median
$653K
79 sales

By home type 12 months to November 3, 2026

TypeMedian soldAgainst South EastDays to sellA quarter sold under
Detached79 sales$653K7th highest of 14About the same46South East: 25$577K
Semi-detached32 sales$527K5th highest of 9About the same68South East: 31$511K
Townhouse38 sales$472K4th highest of 12$62K above54South East: 35$449K

Hotchkiss

New community, still being built

764 homes, 100% of homes built since 2010, detached from $547K.

What stands out

  • Newest homes in the district: 100% built since 2010
  • 2 playgrounds
  • Homes come up often: 16.6% traded in the year
  • No school inside the community
  • Nearest off-leash dog park: Auburn Bay

Watch for

  • Little frequent transit
Entry price
$454K
lowest 25th-percentile sold price of any type
Detached median
$602K
68 sales

By home type 12 months to November 3, 2026

TypeMedian soldAgainst South EastDays to sellA quarter sold under
Detached68 sales$602K12th highest of 14$55K below48South East: 25$547K
Semi-detached35 sales$490K7th highest of 9$40K below52South East: 31$476K
Townhouse24 sales$471K5th highest of 12$61K above43South East: 35$454K

Ricardo Ranch

New community, still being built

292 homes, 100% of homes built since 2010, detached from $576K.

What stands out

  • Backs onto the Bow River valley
  • 2 playgrounds
  • Homes come up often: 15.1% traded in the year
  • No school inside the community
  • Nearest off-leash dog park: Auburn Bay

Watch for

  • Construction for years to come: 5,599 units planned
  • A thin resale record: 44 sales in the window
  • Little frequent transit
Entry price
$487K
lowest 25th-percentile sold price of any type
Detached median
$637K
26 sales

By home type 12 months to November 3, 2026

TypeMedian soldAgainst South EastDays to sellA quarter sold under
Detached26 sales$637K8th highest of 14$19K below50South East: 25$576K
Townhouse12 sales$501K3rd highest of 12$91K above38South East: 35$487K

Riverbend

Riverside community

3,431 homes, 100% of homes built before 2010, detached from $549K.

What stands out

  • Bow River valley pathways, 9 km of regional pathway
  • Most park space in the district: 20% of the land
  • 2 schools inside the community
  • 2 off-leash dog parks inside
  • Established streets: 0% built since 2010, grown-in yards
Entry price
$549K
lowest 25th-percentile sold price of any type
Detached median
$618K
98 sales

By home type 12 months to November 3, 2026

TypeMedian soldAgainst South EastDays to sellA quarter sold under
Detached98 sales$618K10th highest of 14$38K below16South East: 25$549K

Prices: MLS® sales, 12 months to November 3, 2026, shown at 10 or more sales. Parks, schools, playgrounds, childcare, recreation, libraries and off-leash areas: City of Calgary datasets. Shops and services: OpenStreetMap. New builds: builder listings on November 9, 2026. Lake and river: OpenStreetMap water inside or beside the community boundary.

Six of these carry a note from me. What homes cost, by type and by community, comes next.
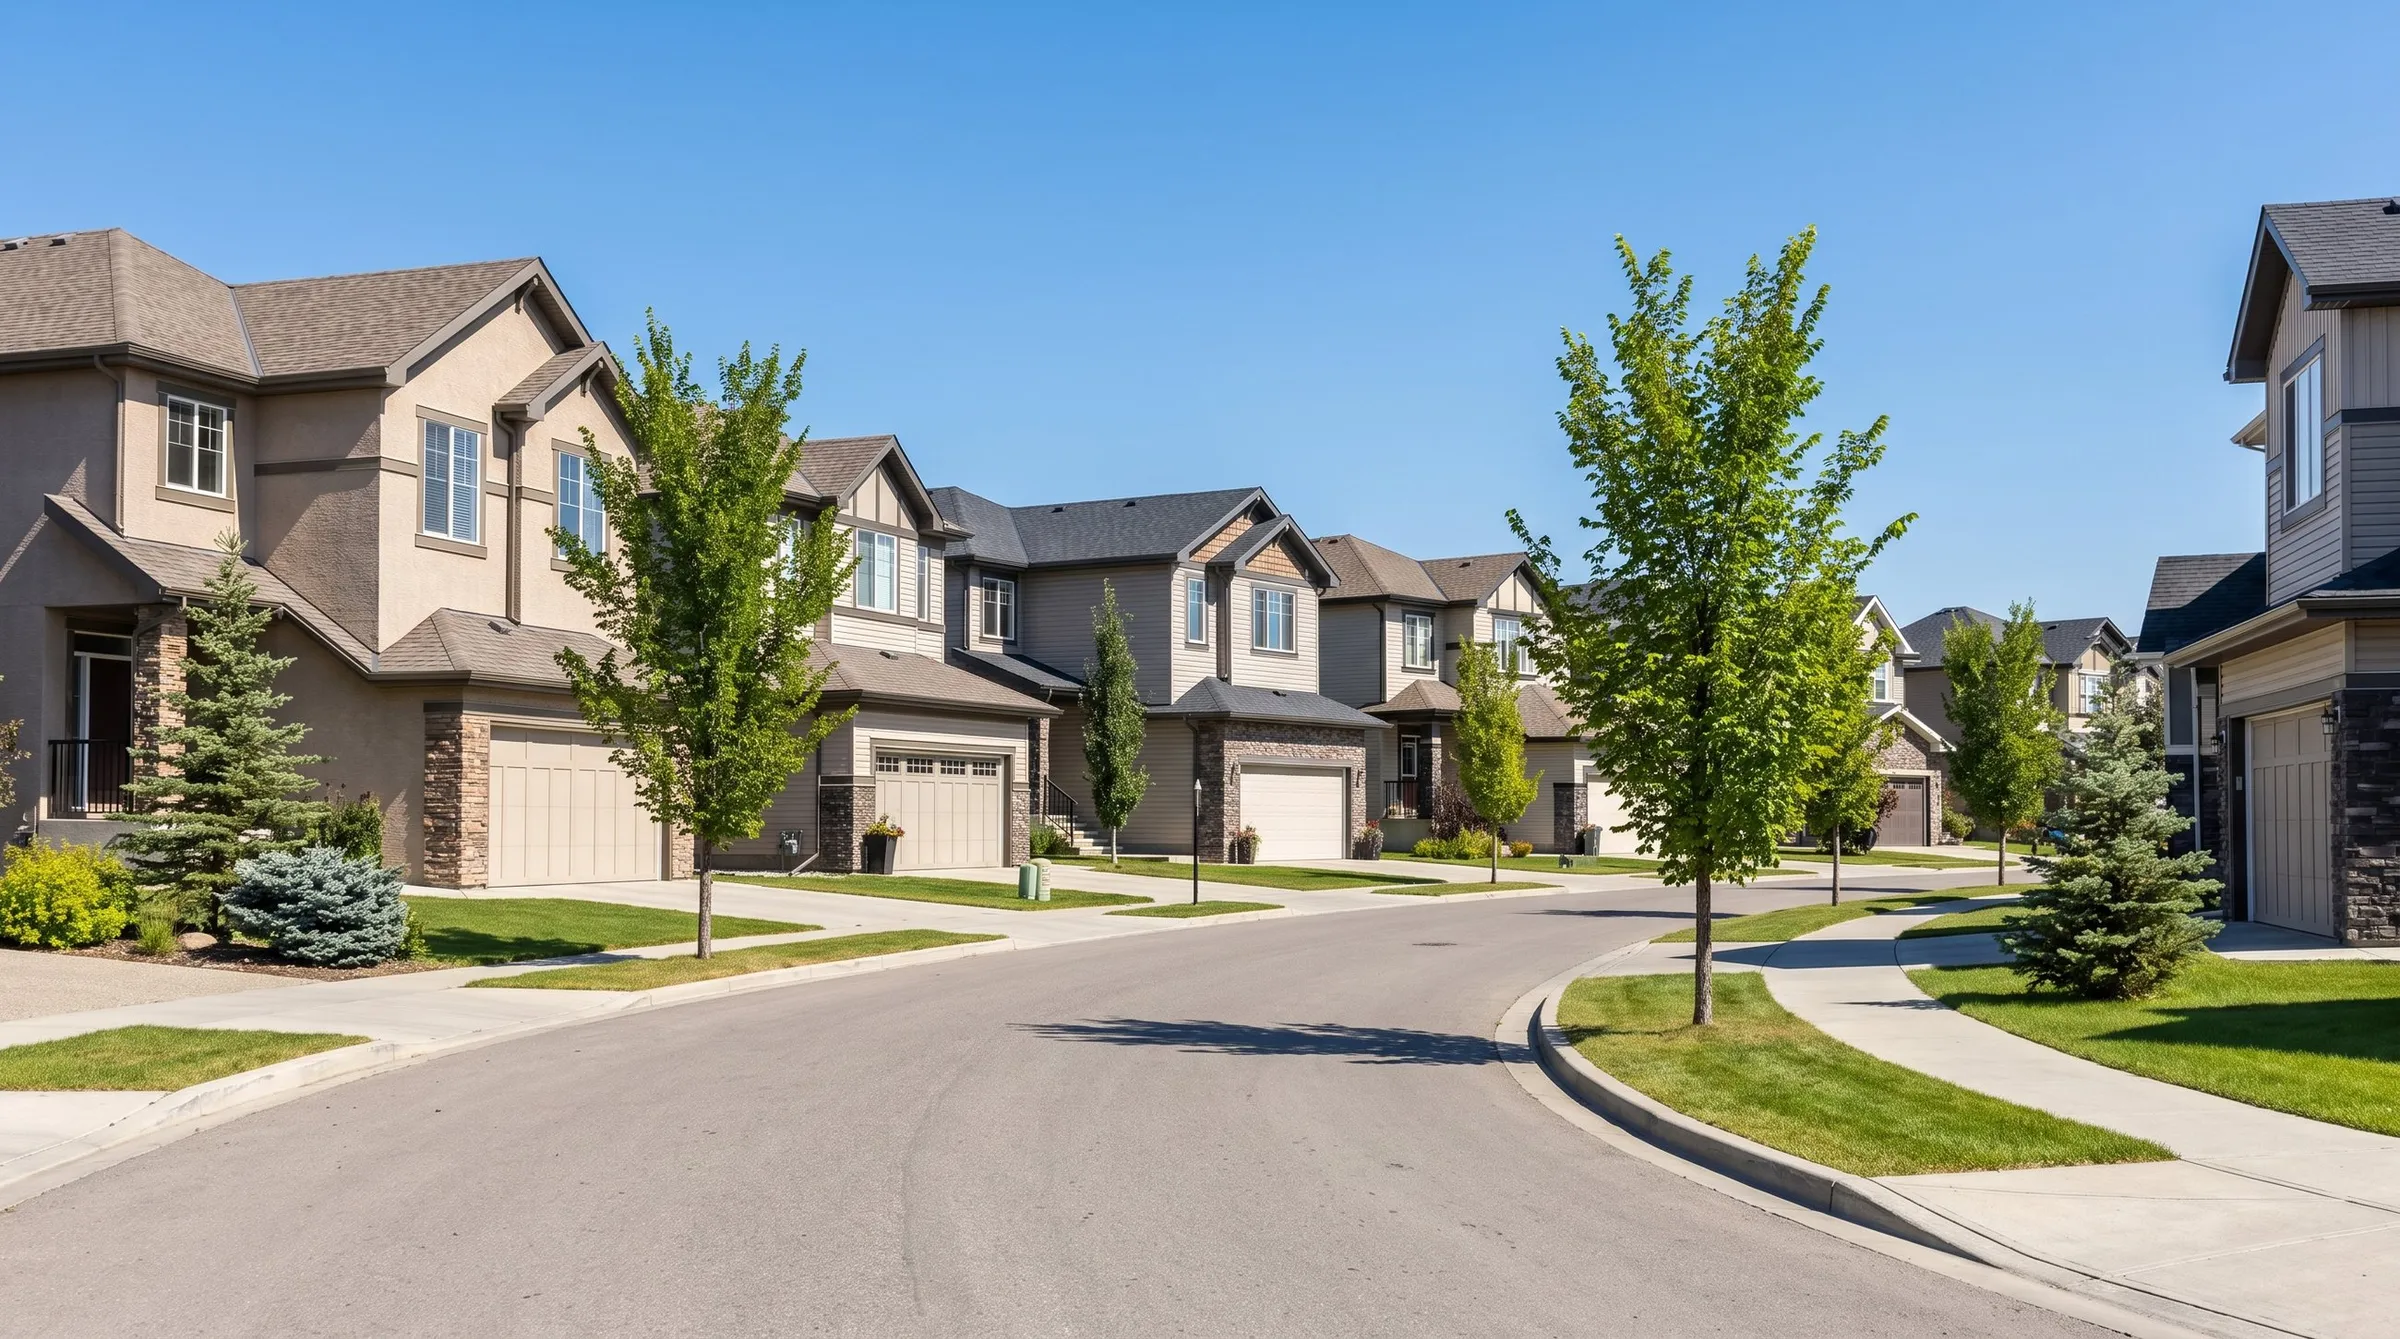
A curving residential street of two-storey houses with attached garages, stone-clad garage fronts, young boulevard trees and a clear sky.

Prices

What do homes cost in South East Calgary?

Over the 12 months to November 3, 2026, a detached home in South East Calgary sold for a median of $656,000, 6% under the city's $695,000.

Pick a type. Every community is ranked by its median sold price over the 12 months to November 3, 2026, and the map shades the same figures.

CranstonMahoganyMcKenzie TowneAuburn BayCopperfieldSetonNew BrightonDouglasdale/GlenMcKenzie LakeRiverbendOgdenRangeviewHotchkissRicardo RanchShepard IndustrialSouth Foothills

Community medians run from $515K to $760K, darker is dearer. Detached sales: the middle 60% sold between $558K and $805K, the median at $656K, and the ends mark the 10th and 90th percentiles ($530K and $950K).

Community medians run from $410K to $585K, darker is dearer. Semi-detached sales: the middle 60% sold between $484K and $595K, the median at $530K, and the ends mark the 10th and 90th percentiles ($455K and $639K). Under 10 semi-detached sales: not shaded.

Community medians run from $380K to $554K, darker is dearer. Townhouse sales: the middle 60% sold between $360K and $482K, the median at $410K, and the ends mark the 10th and 90th percentiles ($327K and $520K). Under 10 townhouse sales: not shaded.

Community medians run from $263K to $480K, darker is dearer. Apartment sales: the middle 60% sold between $250K and $395K, the median at $305K, and the ends mark the 10th and 90th percentiles ($228K and $478K). Under 10 apartment sales: not shaded.

Median detached sold price, shown at 10 or more sales. Darker is dearer.

MLS® sales, 12 months to November 3, 2026

Median semi-detached sold price, shown at 10 or more sales. Darker is dearer.

MLS® sales, 12 months to November 3, 2026

Median townhouse sold price, shown at 10 or more sales. Darker is dearer.

MLS® sales, 12 months to November 3, 2026

Median apartment sold price, shown at 10 or more sales. Darker is dearer.

MLS® sales, 12 months to November 3, 2026

Detached median sold price, highest first

Community medianAll of Calgary: $695K, 24 days to sell

Semi-detached median sold price, highest first

Community medianAll of Calgary: $585K, 28 days to sell

Under 10 semi-detached sales, not ranked: Copperfield, New Brighton, McKenzie Lake, Riverbend and Ricardo Ranch.

Townhouse median sold price, highest first

Community medianAll of Calgary: $418K, 32 days to sell

Under 10 townhouse sales, not ranked: Riverbend and Ogden.

Apartment median sold price, highest first

Community medianAll of Calgary: $295K, 39 days to sell

Under 10 apartment sales, not ranked: New Brighton, McKenzie Lake, Riverbend, Ogden, Rangeview, Hotchkiss and Ricardo Ranch.

Detached, 12 months to November 3, 2026

Median $656KA quarter under $575KHalf sold within 25 daysPer square foot $376Sales 1,733

Sold with four or more bedrooms, the most common size
55%
The size that sells most often here, and its median price.
median $710K · 953 sales
Detached sales that were bungalows
9%
How much of what sold was single-level.
12 months to November 3, 2026 · 1,733 sales
Moving up to four or more bedrooms
$102K
A rough guide: bigger homes differ in more than bedrooms.
from three bedrooms, median to median · 747 and 953 sales

Semi-detached, 12 months to November 3, 2026

Median $530KA quarter under $490KHalf sold within 31 daysPer square foot $381Sales 293

Sold with three bedrooms, the most common size
61%
The size that sells most often here, and its median price.
median $525K · 180 sales
Semi-detached sales with a condo fee
8%
Most semis here carry no fee. Ask whether the one you like does.
median fee $527 / M · 24 sales
Moving up to four or more bedrooms
$65K
A rough guide: bigger homes differ in more than bedrooms.
from three bedrooms, median to median · 180 and 63 sales

Townhouse, 12 months to November 3, 2026

Median $410KA quarter under $370KHalf sold within 35 daysPer square foot $313Sales 592

Sold with two bedrooms or fewer, the most common size
52%
The size that sells most often here, and its median price.
median $384K · 309 sales
Townhouse condo fee, median , a month
$313
The median fee on townhouse sales that recorded one.
12 months to November 3, 2026 · 502 sales
Townhouse to detached, the step up
$276K
The gap between the median townhouse and the median detached home here, from the assessment roll.
City data, November 9, 2026 · homes-weighted median

Apartment, 12 months to November 3, 2026

Median $305KA quarter under $261KHalf sold within 37 daysPer square foot $384Sales 458

Sold with two bedrooms or fewer, the most common size
96%
The size that sells most often here, and its median price.
median $301K · 439 sales
Apartment condo fee, median , a month
$477
The median fee on apartment sales here.
12 months to November 3, 2026 · 458 sales
Moving up to three bedrooms
$128K
A rough guide: bigger homes differ in more than bedrooms.
from two bedrooms or fewer, median to median · 439 and 19 sales

That's what it costs to get in. How hard buyers push, and when, is the next number.

Negotiation

How hard can you negotiate in South East Calgary?

Over the 12 months to November 3, 2026, half the detached homes in South East Calgary sold within 25 days, and 22% sold at or over the asking price.Source: MLS® sales, 12 months to November 3, 2026.

One row per type, 12 months to November 3, 2026. The bar under days to sell covers the middle half of sales, with the median marked. A cut compares the final list price with the original one.

The table scrolls sideways: four measures for each type.

Negotiation room by property type: days to sell, sellers who cut, typical cut, and sales at or over list
Property typeDays to sellmedian; bar is the middle halfSellers who cutshare of salesTypical cutmedian, where cutSold at or over listshare of sales
Detached1,733 sales25 daysmiddle half 14 to 47 days32%3.3%22%
Semi-detached293 sales31 daysmiddle half 17 to 61 days38%3.6%19%
Townhouse592 sales35 daysmiddle half 20 to 60 days42%3.5%16%
Apartment458 sales37 daysmiddle half 22 to 70 days41%5%14%

Darker cells leave a buyer more room to push, compared across the types here. Days axis 0 to 70.

Most room for a buyer: apartments on days to sell (37 days), townhouses on sellers who cut (42%), apartments on the typical cut (5%) and apartments on sales at or over list (14%).

Buyer months and seller months

Every sale on record, January 2024 to November 2026, grouped by the month the home was listed and set against this district's own average month.

Homes listed in September, October, November and December closed furthest under asking, each at a median 98.4% of list price, and took a median 25 to 43 days to sell. Homes listed in February, March and April closed closest to asking, each at a median 99.1% of list price, and took a median 18 to 19 days to sell.

Median sold price as a share of list price, by the month the home was listed, against the average month (98.7%)
Listed inAverage month 98.7%Sold at, % of listDays, medianSales
JanJanuary0.1 points closer to asking than the average month98.8%22748
FebFebruary0.4 points closer to asking than the average month99.1%18829
MarMarch0.4 points closer to asking than the average month99.1%181,038
AprApril0.4 points closer to asking than the average month99.1%191,033
MayMay0.3 points closer to asking than the average month99.0%191,173
JunJune0.1 points closer to asking than the average month98.8%231,019
JulJulylevel with the average month98.7%26868
AugAugust0.2 points further under asking than the average month98.5%24747
SepSeptember0.3 points further under asking than the average month98.4%25747
OctOctober0.3 points further under asking than the average month98.4%27552
NovNovember0.3 points further under asking than the average month98.4%34442
DecDecember0.3 points further under asking than the average month98.4%43226
  • Left, navy: closed further under asking than the average month
  • Right, clay: closed closer to asking than the average month
CranstonMahoganyMcKenzie TowneAuburn BayCopperfieldSetonNew BrightonDouglasdale/GlenMcKenzie LakeRiverbendOgdenRangeviewHotchkissRicardo RanchShepard IndustrialSouth Foothills

Months of supply:

  • 1.3 mo to 2.3 mo
  • 2.3 mo to 3.9 mo
  • 3.9 mo to 4.8 mo
  • 4.8 mo to 9.4 mo
  • no figure: Ricardo Ranch

Days to sell, detached:

  • 15 days to 20 days
  • 20 days to 24 days
  • 24 days to 28 days
  • 28 days to 50 days

Benchmark, year over year:

  • -4% to -2%
  • -2% to 0
  • about 0
  • 0 to +2%
  • +2% to +4%
  • no figure: Rangeview, Hotchkiss, Ricardo Ranch

CREB® months of supply, all types. Darker means more listings per sale, which favours buyers.

CREB® October 2026

Half the detached homes sold within this many days, shown at 10 or more sales. Darker took longer, which leaves a buyer more room.

MLS® sales, 12 months to November 3, 2026

CREB® benchmark price change over a year. Navy shades fell, clay shades rose, and the lightest held about level.

CREB® October 2026

Months of supply, highest first

No CREB® figure: Ricardo Ranch.

Days to sell, detached, fastest first

Benchmark price change over a year, biggest rise first

No CREB® figure: Rangeview, Hotchkiss and Ricardo Ranch.

Months of supply, all types
3.6 mo
Months to sell everything listed at the current pace. Lower favours sellers.
CREB® October 2026 · 221 sales · CREB® district figure
Benchmark price, year over year
-1%
CREB® benchmark for the district, October 2026 against October 2025.
CREB® October 2026 · CREB® district figure
Homes that sold in the year
4.8%
Share of all homes on the roll that changed hands.
City data, November 9, 2026 · homes-weighted median

Getting in is one number. Holding it, month after month, is a different one.

Cost to hold

What does it cost to own a home in South East Calgary, month to month?

Owning the median detached home in South East Calgary costs $3,990 a month in mortgage, property tax and any recorded condo fee, at 4.12% with the minimum down payment, before utilities.Source: my ownership model on MLS® sales, 12 months to November 3, 2026; Bank of Canada new-mortgage rates, August 2026.

Monthly cost to own the median home, by type

Mortgage, property tax and the recorded condo fee, at 4.12% over 25 years

Detached , a month
$3,990
On the median price with the minimum down payment, before utilities.
Income to qualify about $146,000
Semi-detached , a month
$3,090
On the median price with the minimum down payment, before utilities.
Income to qualify about $113,000
Townhouse , a month
$2,680
On the median price with the minimum down payment, before utilities.
Income to qualify about $93,000
Apartment , a month
$2,320
On the median price with the minimum down payment, before utilities.
Income to qualify about $74,000

$533 a month per $100,000 borrowed

Rate used: 4.12% with under 20% down (insured), 4.58% with 20% or more: what chartered banks actually charged on new 5-year fixed mortgages in August 2026 (Bank of Canada). Every cost here uses the minimum down payment, so the insured rate applies. Property tax at the 2026 City rate on the assessed value.

Condo fees by building age

Median monthly fee on apartment and townhouse resales, 12 months to November 3, 2026, grouped by the decade the building went up.

The highest is on buildings from the 2000s, $426 a month. The lowest is on buildings from 2020 or later, $312. From 960 resales that recorded a fee.

  1. Before 2000 (34 resales): $365
  2. 2000s (159 resales): $426
  3. 2010s (489 resales): $385
  4. 2020 and newer (278 resales): $312
Two-bedroom rent , a month
$1,879
CMHC average, October 2025, weighted across the district. What staying a renter costs.
City data, November 9, 2026 · homes-weighted median
Own minus rent, two-bedroom apartment
$470
Monthly cost to own the median two-bedroom apartment, less the rent for one.
City data, November 9, 2026 · 349 sales · sales-weighted median
Gross yield, two-bedroom apartment
7.2%
Annual rent as a share of the median two-bedroom apartment price.
City data, November 9, 2026 · 349 sales · sales-weighted median
Gross yield, two-bedroom townhouse
5.9%
Annual rent as a share of the median two-bedroom townhouse price.
City data, November 9, 2026 · 263 sales · sales-weighted median
Approved secondary suites per 100 homes
9.2
Registered suites on the City list, per 100 homes.
City data, November 9, 2026 · homes-weighted average
Licensed short-term rentals per 1,000 homes
4.3
City licences per 1,000 homes.
City data, November 9, 2026 · homes-weighted median
Water main breaks per 100 homes, ten years
0.1
City records over ten years. Newer pipe breaks less.
City data, November 9, 2026 · homes-weighted average
Public trees that are mature
7%
Share of the City tree inventory here that is fully grown. Newer districts read low.
City data, November 9, 2026 · homes-weighted average
CranstonMahoganyMcKenzie TowneAuburn BayCopperfieldSetonNew BrightonDouglasdale/GlenMcKenzie LakeRiverbendOgdenRangeviewHotchkissRicardo RanchShepard IndustrialSouth Foothills

Monthly cost, detached:

  • $2,997 to $3,549
  • $3,549 to $3,705
  • $3,705 to $4,079
  • $4,079 to $4,395

Monthly cost, apartment:

  • $2,003 to $2,050
  • $2,050 to $2,317
  • $2,317 to $2,345
  • $2,345 to $3,458
  • no figure: New Brighton, McKenzie Lake, Riverbend, Ogden, Rangeview, Hotchkiss, Ricardo Ranch

Townhouse condo fee:

  • $250 to $271
  • $271 to $299
  • $299 to $314
  • $314 to $356
  • no figure: Riverbend, Ogden, Hotchkiss, Ricardo Ranch

Apartment condo fee:

  • $387 to $403
  • $403 to $483
  • $483 to $543
  • $543 to $659
  • no figure: New Brighton, McKenzie Lake, Riverbend, Ogden, Rangeview, Hotchkiss, Ricardo Ranch

Gross yield, 2-bed:

  • 5.6% to 5.9%
  • 5.9% to 6.7%
  • 6.7% to 7.3%
  • 7.3% to 8.4%
  • no figure: McKenzie Lake, Riverbend, Ogden, Rangeview, Hotchkiss, Ricardo Ranch

Two-bedroom rent:

  • $1,879 to $2,007
  • $2,007 to $2,256

Mortgage, tax and fee on the median detached home at 4.12%, with the minimum down payment. Darker costs more a month.

Ownership model, Bank of Canada new-mortgage rates, August 2026

Mortgage, tax and fee on the median apartment at 4.12%, with the minimum down payment. Darker costs more a month.

Ownership model, Bank of Canada new-mortgage rates, August 2026

Median monthly condo fee on the townhouse resales that recorded one. Darker is higher.

MLS® sales, 12 months to November 3, 2026

Median monthly condo fee on apartment resales. Darker is higher.

MLS® sales, 12 months to November 3, 2026

Annual CMHC two-bedroom rent over the median two-bedroom price, before costs. Darker is higher.

CMHC rents, October 2025; MLS® sales

CMHC average two-bedroom rent, by tract or zone. Darker is dearer.

CMHC rents, October 2025

Monthly cost, detached, highest first

Monthly cost, apartment, highest first

Too few apartment sales: New Brighton, McKenzie Lake, Riverbend, Ogden, Rangeview, Hotchkiss and Ricardo Ranch.

Townhouse condo fee, highest first

Too few townhouse sales with a fee: Riverbend, Ogden, Hotchkiss and Ricardo Ranch.

Apartment condo fee, highest first

Too few apartment sales with a fee: New Brighton, McKenzie Lake, Riverbend, Ogden, Rangeview, Hotchkiss and Ricardo Ranch.

Gross yield, 2-bed, highest first

Too few two-bedroom sales: McKenzie Lake, Riverbend, Ogden, Rangeview, Hotchkiss and Ricardo Ranch.

Two-bedroom rent, highest first

Those are the carrying numbers. Daily life is what you're carrying them for.

Daily life

What is daily life like in South East?

32 schools and 144 City playgrounds sit inside South East, with 18.6 licensed childcare spaces for every 100 children under 15. City data, November 9, 2026.
CranstonMahoganyMcKenzie TowneAuburn BayCopperfieldSetonNew BrightonDouglasdale/GlenMcKenzie LakeRiverbendOgdenRangeviewHotchkissRicardo RanchShepard IndustrialSouth Foothills

32 schools inside South East, all boards and levels. A school shows under every level it teaches.

31 elementary schools inside South East. Hover one for its name.

13 schools teaching junior high inside South East. Hover one for its name.

1 school teaching senior high inside South East. Hover it for its name.

137 parks of a hectare or more and 144 City playgrounds inside South East.

137 parks of a hectare or more inside South East.

144 City playgrounds inside South East.

7 recreation facilities and 2 public libraries inside South East. Hover one for its name.

7 recreation facilities inside South East. Hover one for its name.

2 public libraries inside South East. Hover one for its name.

  • Schools 32
  • Playgrounds 144
  • Recreation facilities 7
  • Libraries 2
  • Parks 137

City locations. Schools, recreation facilities and libraries show their names on hover.

City of Calgary open data: schools, November 1, 2026; playgrounds, November 8, 2026; recreation facilities, November 8, 2026; libraries, February 21, 2025; parks, November 5, 2026.

Schools inside the district
32
All boards and levels, City school locations.
City data, November 9, 2026 · district total
Childcare spaces per 100 children under 15
18.6
Licensed spaces against the children on record.
City data, November 9, 2026 · per child under 15
Playgrounds
144
City playground equipment sites.
1 per 1,000 residents · City data, November 9, 2026 · district total
Park space per 1,000 residents
6.6 ha
Hectares of City park per 1,000 residents.
City data, November 9, 2026 · per resident
Grocery stores
23
OpenStreetMap count inside the district.
City data, November 9, 2026 · district total
Restaurants
268
OpenStreetMap counts inside the district.
Also 46 cafes, 29 pharmacies, 11 gyms · City data, November 9, 2026 · district total

How South East feels

  • New, polished and intentionally designed.
  • Wide streets, modern homes and a just-built feel to everything from fire halls to fitness centres.
  • Community events, holiday light displays and school openings: still growing, already lived in.
  • Everything feels new, but it's far from empty.

What locals say

“We moved here from out of province and couldn't believe what you get for the price. Lake access, new schools, trails everywhere.”

“It's a bit of a drive to downtown, but most of our life is right here.”

“Seton has everything. We basically live in our own mini city.”

School attendance areas change; check the CBE and Catholic school finders for any address.

The households on record come next.

Households

Who lives in South East Calgary?

In the 2021 Census, 144,605 residents lived in South East Calgary, in 52,735 households, and 81% of households owned their home.Source: Statistics Canada 2021 Census, as the City of Calgary publishes it by community.
Residents
144,605
2021 Census, population in private households.
2021 Census · district total
Growth, 2014 to 2019
50%
Population change between the City's 2014 and 2019 civic censuses, across the district.
City of Calgary civic census, 2014 to 2019 · population-weighted average
Households
52,735
2021 Census households.
2021 Census · district total
Residents under 15
22.1%
Share of residents aged 0 to 14.
2021 Census · population-weighted average

Household size

Share of households by number of people. Average 2.7.

  1. One person: 19%
  2. Two people: 32%
  3. Three people: 18%
  4. Four people: 20%
  5. Five or more: 10%

People in the household, 2021 Census

Owners

81% of households own their home. One square is one household in a hundred.

  • 81 of 100 own their home
  • 19 of 100 don't

2021 Census · household-weighted average

Couples with children at home
52%
Share of census families.
2021 Census · household-weighted average
One-parent families
13%
Share of census families.
2021 Census · household-weighted average
Commute by transit
4%
Share of commuters, 2021 Census.
2021 Census · population-weighted average
Commute of 30 minutes or more
29%
Share of commuters, 2021 Census.
2021 Census · population-weighted average
CranstonMahoganyMcKenzie TowneAuburn BayCopperfieldSetonNew BrightonDouglasdale/GlenMcKenzie LakeRiverbendOgdenRangeviewHotchkissRicardo RanchShepard IndustrialSouth Foothills

Homes built since 2010:

  • 0% to 15%
  • 15% to 54%
  • 54% to 98%
  • 98% to 100%

Mature public trees:

  • 0% to 0.1%
  • 0.1% to 0.9%
  • 0.9% to 5%
  • 5% to 40%

Share of homes on the assessment roll built in 2010 or later. Darker is newer.

City of Calgary 2026 assessment roll

Share of the City's public trees here that are fully grown. Newer streets read low. Darker is more.

City of Calgary tree inventory

Homes built since 2010, newest first

Mature public trees, highest first

Now the part of the file that buyers skip and lawyers don't.

Before you offer

What should you check before you offer in South East?

City of Calgary maps put 0.2% of South East's 46,877 residential lots in the 1:100 flood zone and none inside the NEF 25 aircraft noise band, as of November 9, 2026.
CranstonMahoganyMcKenzie TowneAuburn BayCopperfieldSetonNew BrightonDouglasdale/GlenMcKenzie LakeRiverbendOgdenRangeviewHotchkissRicardo RanchShepard IndustrialSouth Foothills
  • Floodway
  • Flood fringe
  • NEF 25 noise band
  • Freight rail
  • Busiest roads (2024 counts)

The City's own hazard maps. Hover a busy road for its 2024 count.

City of Calgary: regulatory flood map, September 3, 2026; noise exposure forecast contours, October 1, 2026; non-LRT tracks, October 1, 2026; 2024 traffic volumes, August 5, 2025.

Each tile is the share of the district's residential lots that one City hazard layer touches. I name a community when 10% or more of its lots sit in the flood zone, 20% or more inside the noise band or beside freight rail, or 5% or more beside one of the busiest roads.

Lots in the 1:100 flood zone
0.2%
No community at 10% of lots or more · 46,877 lots
Lots in the floodway
0%
46,877 lots
Lots inside the NEF 25 noise band
0%
No community at 20% of lots or more · 46,877 lots
Lots beside the busiest roads
1.7%
At 5% of lots or more: Douglasdale/Glen (5.8%) · 46,877 lots
Lots beside freight rail
0.4%
No community at 20% of lots or more · 46,877 lots
Lots inside a landfill setback
0.1%
46,877 lots

Share of residential lots · City data, November 9, 2026

Weather and the outdoors

Climate

Warmer and sunnier than the North West or North: open skies, less wind, lots of south-facing lots.

Snow

Lighter snowfall. Wide sidewalks and full sun mean early melt and dry pavement.

Natural integration

Bow River trails in Cranston, storm ponds, green corridors and the lakes in Mahogany and Auburn Bay.

Hail

Moderate exposure. Many newer builds use impact-resistant roofing and siding; ask which.

The weather down here is a win: longer summers, fewer shovelling days, and with lake access it feels like a resort half the year.

Four things I check on your behalf here

  1. Lake and association fees are on title

    Lake communities carry mandatory annual fees, registered as an encumbrance. Ask the amount, what it covers and the rules.

  2. New build means builder diligence

    GST and the first-time buyers rebate, the deposit schedule, what is excluded, and your own inspection before possession.

  3. Ask about the roof

    Hail is a real cost in Calgary. On a newer build, ask what class of roofing went on. On a resale, ask about claims.

  4. Do not pay for the Green Line yet

    The funded first phase ends at Shepard. Stations planned nearer these communities have no funded construction stage.

What's being built next door changes all of this over time.

What's coming

What is coming to South East Calgary?

The City permitted 5,331 housing units in South East Calgary in the 24 months to November 6, 2026, and builders were advertising 468 new homes here on November 9, 2026 (City of Calgary building permits; builders' public listings).
CranstonMahoganyMcKenzie TowneAuburn BayCopperfieldSetonNew BrightonDouglasdale/GlenMcKenzie LakeRiverbendOgdenRangeviewHotchkissRicardo RanchShepard IndustrialSouth FoothillsMahogany: 89 new-build listings89Seton: 74 new-build listings74Rangeview: 66 new-build listings66Hotchkiss: 159 new-build listings159Ricardo Ranch: 80 new-build listings80

Units permitted, 24 months:

  • 0 to 50
  • 50 to 623
  • 623 to 1,773

New-build listings:

  • 0 to 66
  • 66 to 159

Units planned:

  • 320 to 2,735
  • 2,735 to 4,274
  • 4,274 to 4,414
  • 4,414 to 9,851
  • no figure: Cranston, McKenzie Towne, Auburn Bay, New Brighton, Douglasdale/Glen, McKenzie Lake, Riverbend, Ogden

Key:

  • New-build listings, circle size is the count
  • Green Line station, planned
  • Regional pathways

Housing units the City permitted in two years. Darker is more.

City of Calgary building permits, 24 months to November 6, 2026

Homes builders were advertising in the community on the date shown. Darker is more.

builders' public listings, November 9, 2026

Units in approved outline plans and area structure plans, on land not yet built. Darker is more.

City of Calgary, November 9, 2026

Units permitted, 24 months, highest first

New homes builders are advertising, most first

Units planned, highest first

None on record: Cranston, McKenzie Towne, Auburn Bay, New Brighton, Douglasdale/Glen, McKenzie Lake, Riverbend and Ogden.

Housing units permitted, 24 months
5,331
New homes the City approved here in two years.
City data, November 9, 2026 · district total
Units planned on land not yet built
27,193
Approved outline plans and area structure plans, City of Calgary.
City data, November 9, 2026 · district total
New-build listings live
468
Homes builders were advertising in the district on the date shown.
17 builders active · builders' listings, November 9, 2026
Builder price cuts, 8 weeks
192
Builder listings whose asking price fell in the last eight weeks.
builders' listings, November 9, 2026 · district total
Development permit applications, 24 months
110
Residential development permits applied for.
City data, November 9, 2026 · district total
Land-use redesignation applications, 24 months
34
Rezoning applications in the district.
City data, November 9, 2026 · district total

Most new-build listings: Hotchkiss (159), Mahogany (89), Ricardo Ranch (80) and Seton (74), in builders' listings, November 9, 2026.

The 17 builders advertising here: Baywest, Broadview, Brookfield, Cardel, Cedarglen, Excel, Genesis, Homes by Avi, Hopewell, Jayman, Logel, Morrison, NuVista, Rohit, Sterling, StreetSide and Trico.

Green Line stations planned near South East

StationConstruction stage
Auburn Bay / Mahoganyno funded stage
Douglas GlenSE Segment
McKenzie Towneno funded stage
OgdenSE Segment
Prestwickno funded stage
Setonno funded stage

City of Calgary, planned Green Line stations as of June 24, 2026. Locations may change.

What I expect to change

  • Active expansionThe most active new-build area in the city, with phases underway in Hotchkiss, Mahogany, Seton and Rangeview.
  • SetonGrowing into a self-contained urban core, with shopping and hospital access in walking distance.
  • Future transitThe Green Line's funded first phase ends at Shepard. The SE stations are on the long-term plan with no funded stage.
  • Community evolutionNew schools, plazas and restaurants keep opening in Mahogany, Auburn Bay and Seton.

The South East is still unfolding, so when you buy here you're also buying into what's coming. Buy carefully and you get the lifestyle now and room for value later.

If you'd rather see it than read it, the tour is next.
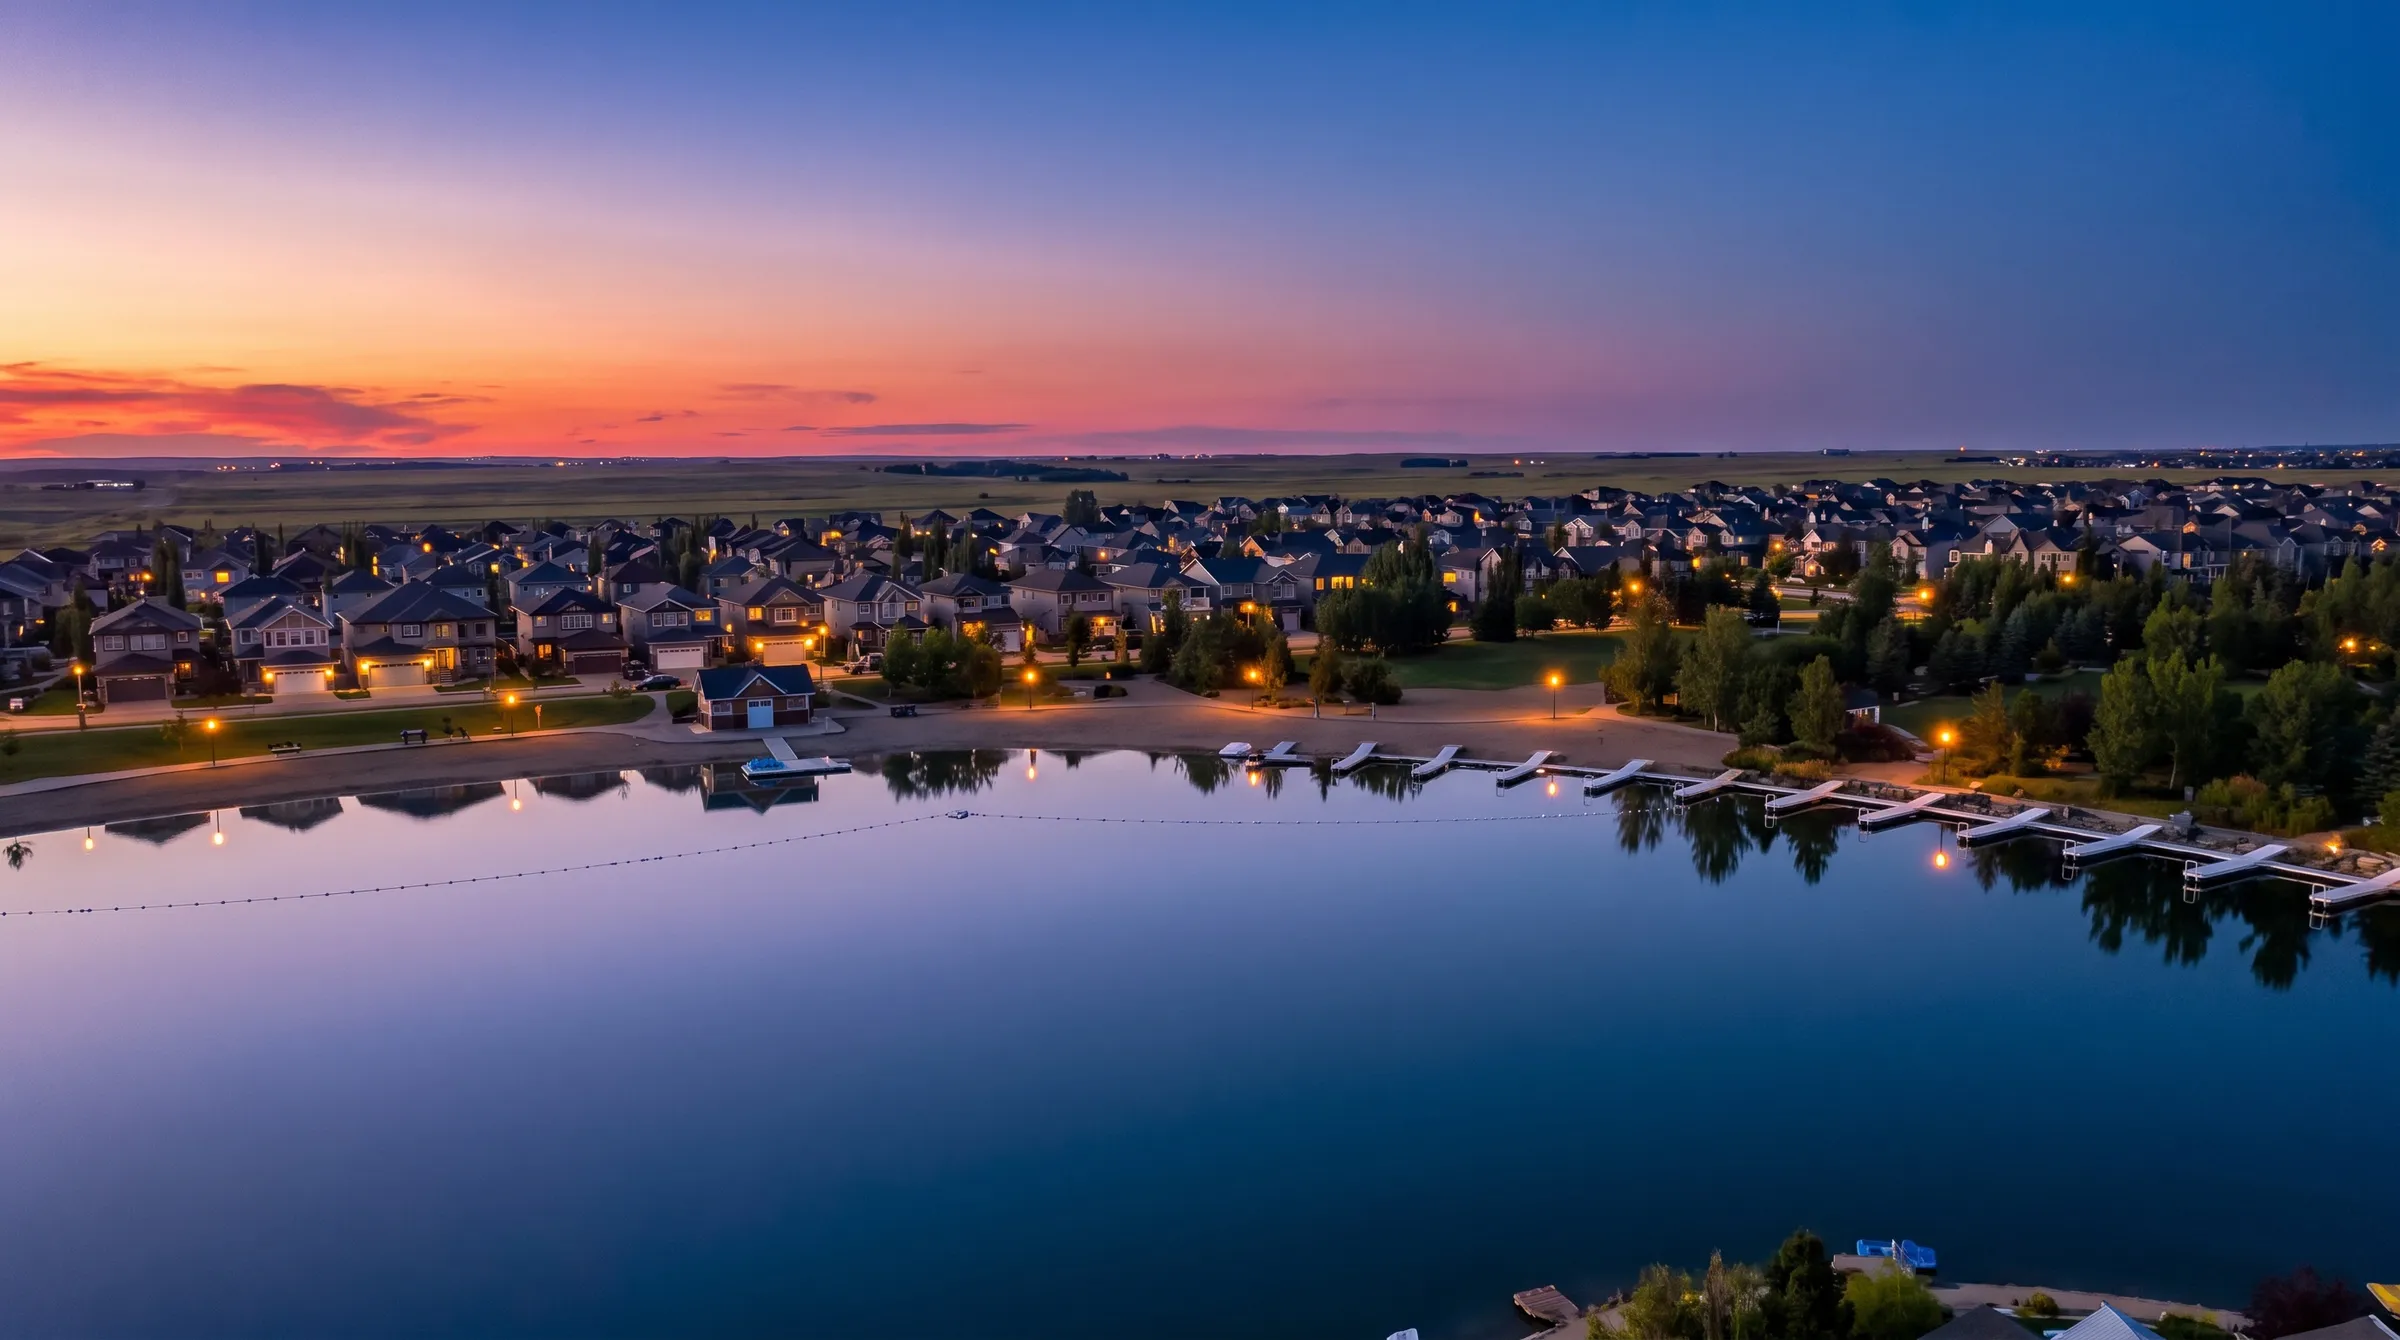
A lake community at dusk: lit houses along the far shore, a row of docks on still water, and the last red light on the horizon.

Is it for you

Is South East right for you?

  • You want a newer home with minimal renos

    Modern, turnkey properties.

  • You value lake life and modern amenities

    Resident beaches, the South Health Campus and new shopping.

  • You'll trade some commute time for convenience

    Most daily needs are met locally.

  • You want a self-contained, walkable area

    Planned communities built for how people live today.

South East Calgary is what a lot of people picture when they imagine their next chapter: a newer home in a community designed around how people live today.

South East · 14 residential communities · 60,906 homes

See it before you visit

Hidden Gems & Best Communities in Calgary: the full guide. My walkthrough of every Calgary region; it loads from YouTube when you press play.

Watch the market updates

Still have questions?

Is there something you'd like to know?

I'd be happy to help. Tell me your budget and the communities you circled in South East, and I'll show you what actually sold there.

Book a call(opens in a new tab)Read testimonials

Sources

MLS® sales, 12 months to November 3, 2026 · CREB® October 2026 · builders' public listings, November 9, 2026 · City of Calgary open data · OpenStreetMap · CMHC · Bank of Canada, August 2026 · 2021 Census. No median under 10 sales. Photographs are illustrations.

How each figure is built
  • Sales. Medians and price curves: MLS® sales in Ash Iyer's archive, 12 months to November 3, 2026. Price per square foot uses the listing's recorded floor area. Negotiation figures cover the same window; the monthly pattern uses every sale on record for this district, grouped by listing month (close date minus days on market).
  • CREB®. Months of supply and benchmark change: CREB® district statistics for October 2026. Source: CREB®.
  • New construction. New builds: homes advertised in builders' public listings, November 9, 2026.
  • Getting around. Drive times: OpenStreetMap routing from each community's centre, no traffic model, so treat them as a floor. Transit, bikeways, pathways and snow routes: City of Calgary. CTrain: a station within 1.2 km, straight line.
  • Ownership costs. Monthly cost to own: Ash Iyer's ownership-cost model at the minimum down payment, with the rate chartered banks actually charged on new 5-year fixed mortgages in August 2026 (Bank of Canada: 4.12% insured, under 20% down; 4.58% uninsured), 25-year amortisation, 2026 tax rate and the recorded condo fee. Rents: CMHC, October 2025. Suites and short-term rentals: City of Calgary.
  • Housing stock. Homes, construction era, turnover and the move-up step: City of Calgary 2026 assessment roll (valued July 1, 2025) and MLS® sales.
  • Supply pipeline. Building permits, development permits, land-use redesignations and planned units: City of Calgary open data, Oct 2026; 24 months to 2026-11-06.
  • Schools family. City of Calgary school, childcare, playground, recreation, library, parks and health datasets. Amenity counts: OpenStreetMap.
  • Risk diligence. Flood, aircraft noise, busy roads, rail and landfill setbacks: City of Calgary open data (1:100 flood map 2023, NEF contours, 2024 traffic volumes). Water main breaks: City of Calgary, ten years.
  • People. 2021 Census by community and the City's civic census (City of Calgary open data). Descriptive only: this describes the households and housing on record, not who should live here.
  • Roll-ups. median of communities: median across the district's residential communities (200 or more homes), commute minutes rounded up; sales-weighted median: median across the district's community and property-type records, weighted by sales; homes-weighted median: median across the district's communities, weighted by homes; homes-weighted average: average across the district's communities, weighted by homes; household-weighted average: average across the district's communities, weighted by households; population-weighted average: average across the district's communities, weighted by residents; area-weighted average: average across the district's communities, weighted by land area; share of residential lots: share of all residential lots in the district's communities; share of homes: share of all homes in the district's communities; district total: total across the district's communities; per resident: total across the district's communities, per resident; per child under 15: total across the district's communities, per child under 15; CREB® district figure: CREB® district figure, as published; derived from the figures beside it: derived from the figures beside it.
  • Floors. No median is shown under 10 sales; no listing month under 15 sales. Figures refresh when the sales archive or the weekly data run updates, and every date on this page is read from the data.
  • Map. City of Calgary community boundaries (Open Data Terms of Use), grouped by CREB district; OpenStreetMap water bodies via Overpass (ODbL), cached copy 2026-11-11.
  • Photographs. Illustrations of the district, not photographs of a specific street or home.