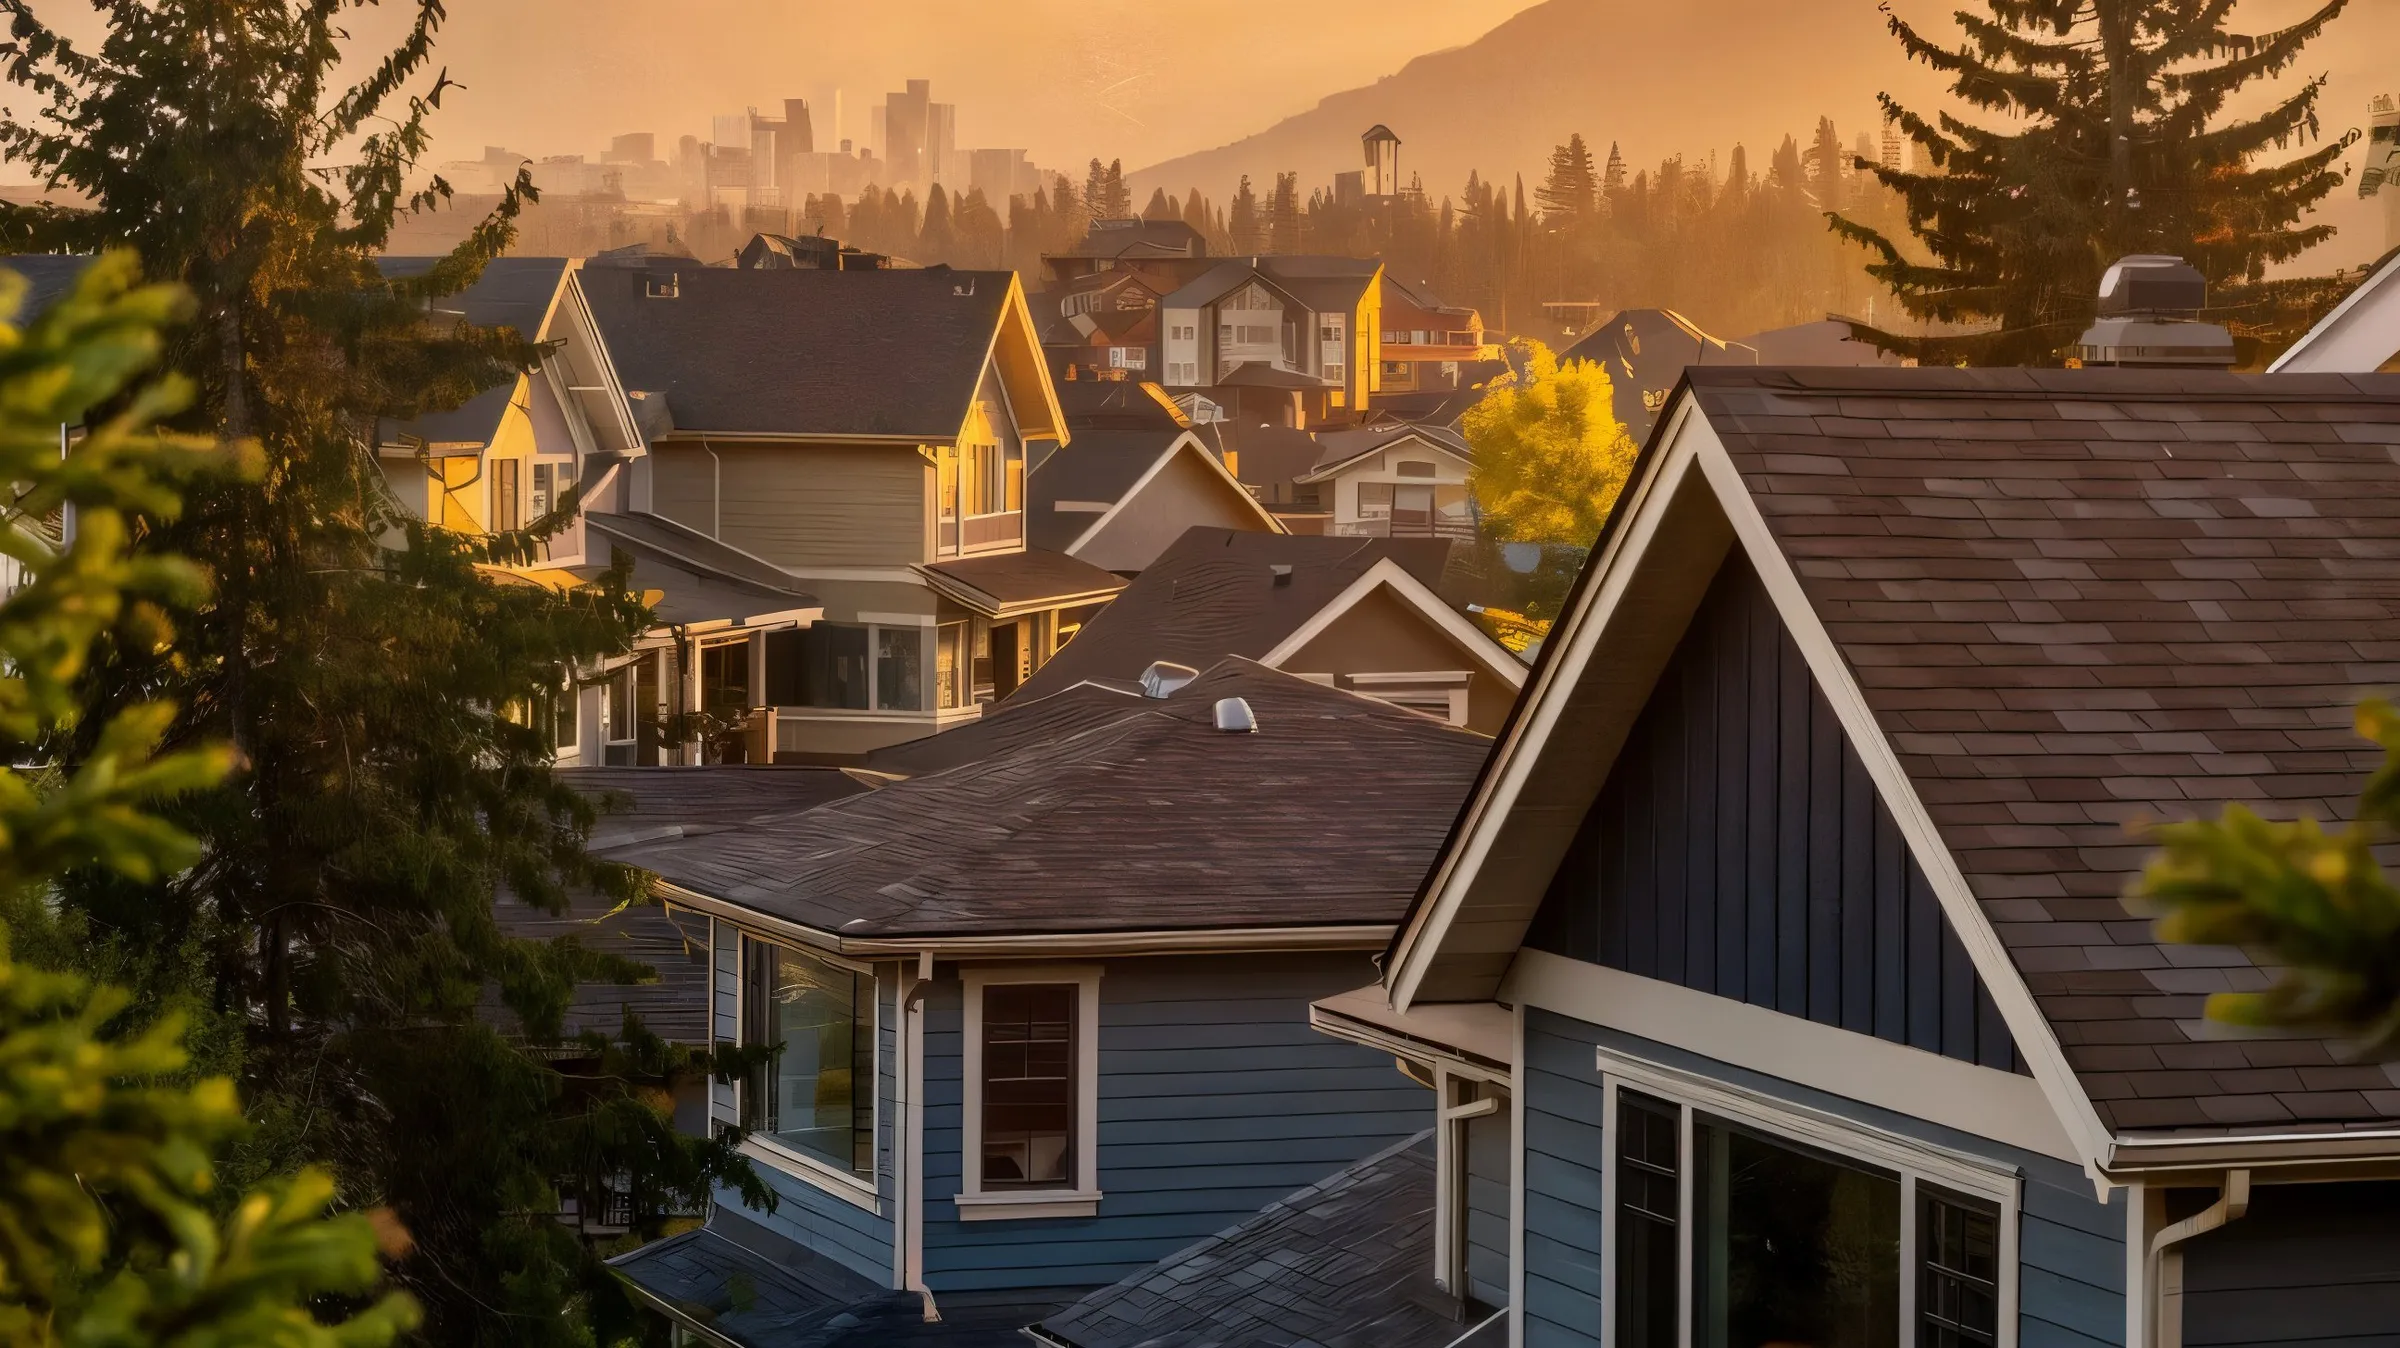
West Calgary

Prestige, tranquility and the gateway to the mountains

Detached median
$958K
Half of detached sales closed above this, half below.
Apartment median
$325K
Half of apartment sales closed above this, half below.
Drive to downtown
15 min
Routed with no traffic, so treat it as a floor.
Homes built since 2010
19%
How much of the housing here is under 16 years old.

Sales to November 3, 2026 (last export 17 days ago)CREB® October 2026

The read

What is true about West right now?

Over the 12 months to November 3, 2026, a detached home in West Calgary sold for a median of $958,000, 38% over the city's $695,000, and an apartment for $325,000. Half the detached homes here sold within 18 days. 19% of the district's homes were built since 2010, and the median drive to downtown is 15 minutes with no traffic.

That's the district in one paragraph. Where it sits, and what the location costs in minutes, comes first.

My read

If you want peaceful streets, larger homes and sunset views of the Rockies, West Calgary might check every box.

Where it sits

Where is West Calgary, and what does the location cost in minutes?

The median drive to downtown from a West Calgary community is 15 minutes with no traffic, from 10 minutes for the closest to 24 for the farthest (OpenStreetMap routing; City data, November 9, 2026).
Drive to downtown, median
15 min
Routed with no traffic, so treat it as a floor.
Walk to the nearest transit stop
3 min
Median across communities, to any stop.
Near a frequent bus route
27%
Share of the district within reach of a route that runs every 15 minutes or better.
Communities near a CTrain station
6of 25
Within 1.2 km of a station, straight line.
Signal HillWest SpringsSpringbank HillAspen WoodsGlenbrookSpruce CliffGlamorganPattersonCougar RidgeStrathcona ParkDiscovery RidgeValley RidgeLakeviewCoach HillCurrie BarracksLincoln ParkCrestmontNorth Glenmore ParkWestgateRosscarrockGlendaleWildwoodGarrison GreenChristie ParkRutland ParkMedicine Hill

Key:

  • West
  • Every ten minutes of driving
  • Hub
  • Driving route
  • Transit stop
  • Frequent route and its stops
  • CTrain station

Each ring is ten minutes of driving from the district's centre. Median drive with no traffic: Downtown 15 min, U of C 16 min, Quarry Park 22 min, YYC 30 min and South Health 30 min. Tap a figure above the map to show it.

OpenStreetMap routing, no traffic. Calgary Transit GTFS. City data, November 9, 2026.

Drive to downtown, shortest first

Near a frequent bus route, highest first

Walk to a transit stop, shortest first

Getting around, from someone who lives here

Downtown via Bow Trail or Sarcee Trail. The Blue Line serves the west side as far as 69 Street; further west you'll drive. Highway 1 puts Banff and Kananaskis about 60 to 75 minutes away.

Errands. Efficient but car-dependent: groceries, schools and rec centres are clustered, not walkable from every pocket.

If peaceful evenings and Sunday hikes matter more than 10-minute grocery runs, this district feels like a private suburb with mountain privileges.

The communities inside it are where the decision gets made.

Communities

Which West communities should you look at, and why?

26 communities, each read from the record: what kind of place it is, what its homes sell for, where it ranks and what to watch for.
Signal HillWest SpringsSpringbank HillAspen WoodsGlenbrookSpruce CliffGlamorganPattersonCougar RidgeStrathcona ParkDiscovery RidgeValley RidgeLakeviewCoach HillCurrie BarracksLincoln ParkCrestmontNorth Glenmore ParkWestgateRosscarrockGlendaleWildwoodGarrison GreenChristie ParkRutland ParkMedicine Hill
  • Lake community
  • Riverside community
  • New community, still being built
  • Established community
  • Community

Kinds of place here come from a lake inside the community, a river valley at its edge, how much was built since 2010 and how much is still being built. Pick a community on the map to open its profile below.

City boundaries, OpenStreetMap water, 2026 assessment roll, City facilities.

In order of entry price, lowest first.

1 of 26

Coach Hill

Established community

1,647 homes, 99% of homes built before 2010, detached from $718K.

What stands out

  • 1 off-leash dog park inside
  • Among the lowest entry prices in the district: from $201K
  • 4 playgrounds
  • No school inside the community

Watch for

  • Among the highest apartment condo fees in the district ($770 a month on the median resale)
  • Little frequent transit
Elevated city views and steady resale.
My note
Entry price
$201K
lowest 25th-percentile sold price of any type
Detached median
$775K
27 sales

By home type 12 months to November 3, 2026

TypeMedian soldAgainst WestDays to sellA quarter sold under
Detached27 sales$775K19th highest of 23$183K below15West: 18$718K
Townhouse33 sales$382K12th highest of 13$95K below30West: 29$340K
Apartment15 sales$390K3rd highest of 12$65K above19West: 34$201K

Glamorgan

Established community

2,235 homes, 100% of homes built before 2010, detached from $672K.

What stands out

  • 2 schools inside the community
  • 1 off-leash dog park inside
  • Among the lowest entry prices in the district: from $205K
  • Most shops and services in the district: 52 places
  • Established streets: 1% built since 2010, grown-in yards

Watch for

  • Little frequent transit
Entry price
$205K
lowest 25th-percentile sold price of any type
Detached median
$739K
27 sales

By home type 12 months to November 3, 2026

TypeMedian soldAgainst WestDays to sellA quarter sold under
Detached27 sales$739K22nd highest of 23$219K below21West: 18$672K
Townhouse48 sales$395K11th highest of 13$82K below36West: 29$323K
Apartment15 sales$233K12th highest of 12$93K below30West: 34$205K

Garrison Green

Established community

660 homes, 98% of homes built before 2010, apartments from $232K.

What stands out

  • Among the lowest entry prices in the district: from $232K
  • 3 playgrounds
  • Frequent bus routes cover 100% of the community
  • Mixed housing: 35% detached, 38% apartments
  • No school inside the community

Watch for

  • A thin resale record: 37 sales in the window
  • 5% of lots back onto the busiest roads
Entry price
$232K
lowest 25th-percentile sold price of any type
Apartment median
$247K
20 sales

By home type 12 months to November 3, 2026

TypeMedian soldAgainst WestDays to sellA quarter sold under
Townhouse10 sales$687Kthe highest of 13$210K above22West: 29$614K
Apartment20 sales$247K11th highest of 12$79K below28West: 34$232K

Lincoln Park

Established community

821 homes, 100% of homes built before 2010, apartments from $234K.

What stands out

  • 1 school inside the community
  • Established streets: 0% built since 2010, grown-in yards
  • 2 playgrounds, 3 childcare programs
  • Frequent bus routes cover 97% of the community
  • Mixed housing: 0% detached, 74% apartments

Watch for

  • A thin resale record: 51 sales in the window
Entry price
$234K
lowest 25th-percentile sold price of any type
Apartment median
$264K
48 sales

By home type 12 months to November 3, 2026

TypeMedian soldAgainst WestDays to sellA quarter sold under
Apartment48 sales$264K10th highest of 12$61K below28West: 34$234K

Springbank Hill

Riverside community

4,073 homes, 34% of homes built since 2010, detached from $885K.

What stands out

  • Elbow River valley pathways, 10 km of regional pathway
  • Westside Recreation Centre inside
  • 6 schools inside the community
  • 13 playgrounds, 4 childcare programs
  • 45 ha of natural area
Larger, estate-style homes with mountain views.
My note
Entry price
$251K
lowest 25th-percentile sold price of any type
Detached median
$1.18M
109 sales

By home type 12 months to November 3, 2026

TypeMedian soldAgainst WestDays to sellA quarter sold under
Detached109 sales$1.18Mtied for 7th highest of 23$217K above20West: 18$885K
Semi-detached12 sales$896Kthe highest of 7$157K above14West: 23$740K
Townhouse37 sales$563K3rd highest of 13$86K above31West: 29$450K
Apartment36 sales$329K7th highest of 12About the same44West: 34$251K

Glenbrook

Established community

2,261 homes, 84% of homes built before 2010, detached from $675K.

What stands out

  • 5 schools inside the community
  • 1 off-leash dog park inside
  • Most shops and services in the district: 50 places
  • 6 playgrounds, 5 childcare programs
  • Bungalows: 78% of detached sales were single-level

Watch for

  • Little frequent transit
Entry price
$269K
lowest 25th-percentile sold price of any type
Detached median
$755K
37 sales

By home type 12 months to November 3, 2026

TypeMedian soldAgainst WestDays to sellA quarter sold under
Detached37 sales$755K21st highest of 23$203K below22West: 18$675K
Semi-detached52 sales$858K3rd highest of 7$119K above33West: 23$679K
Townhouse36 sales$293K13th highest of 13$185K below22West: 29$269K

Patterson

Riverside community

1,929 homes, 95% of homes built before 2010, detached from $1.24M.

What stands out

  • Backs onto the river valley
  • 1 off-leash dog park inside
  • 2 playgrounds
  • 31% of the land is park
  • 52 ha of natural area

Watch for

  • Among the highest apartment condo fees in the district ($675 a month on the median resale)
  • Little frequent transit
Entry price
$274K
lowest 25th-percentile sold price of any type
Detached median
$1.34M
15 sales

By home type 12 months to November 3, 2026

TypeMedian soldAgainst WestDays to sellA quarter sold under
Detached15 sales$1.34M3rd highest of 23$387K above29West: 18$1.24M
Semi-detached15 sales$674K4th highest of 7$65K below26West: 23$644K
Townhouse33 sales$459K8th highest of 13$18K below35West: 29$416K
Apartment27 sales$325K8th highest of 12About the same38West: 34$274K

Signal Hill

Riverside community

5,180 homes, 99% of homes built before 2010, detached from $818K.

What stands out

  • Elbow River valley pathways, 12 km of regional pathway
  • Westside Recreation Centre inside
  • 1 school inside the community
  • Most shops and services in the district: 57 places
  • Signal Hill Library inside
Elevated city views and steady resale.
My note
Entry price
$290K
lowest 25th-percentile sold price of any type
Detached median
$890K
93 sales

By home type 12 months to November 3, 2026

TypeMedian soldAgainst WestDays to sellA quarter sold under
Detached93 sales$890K15th highest of 23$68K below19West: 18$818K
Semi-detached22 sales$641K6th highest of 7$98K below16West: 23$565K
Townhouse21 sales$420K10th highest of 13$57K below28West: 29$395K
Apartment63 sales$308K9th highest of 12$17K below24West: 34$290K

Spruce Cliff

Riverside community

1,618 homes, 90% of homes built before 2010, detached from $998K.

What stands out

  • Backs onto the river valley
  • Killarney Aquatic & Recreation Centre inside
  • 2 schools inside the community
  • 1 off-leash dog park inside
  • 1 playground, 1 childcare program

Watch for

  • Among the highest apartment condo fees in the district ($722 a month on the median resale)
Entry price
$290K
lowest 25th-percentile sold price of any type
Detached median
$1.13M
12 sales

By home type 12 months to November 3, 2026

TypeMedian soldAgainst WestDays to sellA quarter sold under
Detached12 sales$1.13M9th highest of 23$174K above24West: 18$998K
Apartment76 sales$338K6th highest of 12$13K above38West: 34$290K

Currie Barracks

New community, still being built

969 homes, 100% of homes built since 2010, detached from $1.38M.

What stands out

  • 8 schools inside the community
  • Newest homes in the district: 100% built since 2010
  • 1 playground
  • 15% of the land is park
  • Frequent bus routes cover 89% of the community

Watch for

  • A thin resale record: 59 sales in the window
Entry price
$296K
lowest 25th-percentile sold price of any type
Detached median
$1.55M
15 sales

By home type 12 months to November 3, 2026

TypeMedian soldAgainst WestDays to sellA quarter sold under
Detached15 sales$1.55Mthe highest of 23$592K above40West: 18$1.38M
Apartment31 sales$350K5th highest of 12$25K above31West: 34$296K

Aspen Woods

Lake community

3,259 homes, 55% of homes built since 2010, detached from $1.1M.

What stands out

  • Aspen Woods Lake inside the community
  • 4 schools inside the community
  • 10 playgrounds, 7 childcare programs
  • 18% of the land is park
  • 45 ha of natural area

Watch for

  • Check title for a lake association fee
  • Little frequent transit
Larger, estate-style homes with mountain views.
My note
Entry price
$334K
lowest 25th-percentile sold price of any type
Detached median
$1.41M
90 sales

By home type 12 months to November 3, 2026

TypeMedian soldAgainst WestDays to sellA quarter sold under
Detached90 sales$1.41M2nd highest of 23$448K above21West: 18$1.1M
Townhouse46 sales$533K5th highest of 13$56K above32West: 29$514K
Apartment28 sales$360K4th highest of 12$35K above38West: 34$334K

Discovery Ridge

Riverside community

1,733 homes, 95% of homes built before 2010, detached from $982K.

What stands out

  • Elbow River valley pathways, 5 km of regional pathway
  • Most park space in the district: 41% of the land
  • 7 playgrounds, 2 childcare programs
  • 135 ha of natural area
  • Mixed housing: 55% detached, 33% apartments

Watch for

  • 38% of lots sit in the regulatory flood zone
Entry price
$386K
lowest 25th-percentile sold price of any type
Detached median
$1.22M
48 sales

By home type 12 months to November 3, 2026

TypeMedian soldAgainst WestDays to sellA quarter sold under
Detached48 sales$1.22M5th highest of 23$265K above16West: 18$982K
Apartment26 sales$437K2nd highest of 12$112K above28West: 34$386K

West Springs

Community

4,610 homes, 46% of homes built since 2010, detached from $985K.

What stands out

  • 3 schools inside the community
  • 11 playgrounds, 8 childcare programs
  • Nearest off-leash dog park: Coach Hill

Watch for

  • Little frequent transit
Walkable neighbourhoods with modern homes and amenities.
My note
Entry price
$388K
lowest 25th-percentile sold price of any type
Detached median
$1.18M
105 sales

By home type 12 months to November 3, 2026

TypeMedian soldAgainst WestDays to sellA quarter sold under
Detached105 sales$1.18Mtied for 7th highest of 23$217K above12West: 18$985K
Semi-detached11 sales$661K5th highest of 7$78K below12West: 23$580K
Townhouse53 sales$539K4th highest of 13$62K above29West: 29$406K
Apartment42 sales$485Kthe highest of 12$160K above60West: 34$388K

Lakeview

Riverside community

1,987 homes, 94% of homes built before 2010, detached from $800K.

What stands out

  • Backs onto the Elbow River valley
  • 3 schools inside the community
  • 2 off-leash dog parks inside
  • 6 playgrounds, 4 childcare programs
  • Bungalows: 60% of detached sales were single-level
Entry price
$404K
lowest 25th-percentile sold price of any type
Detached median
$975K
72 sales

By home type 12 months to November 3, 2026

TypeMedian soldAgainst WestDays to sellA quarter sold under
Detached72 sales$975K10th highest of 23$17K above14West: 18$800K
Townhouse10 sales$487K7th highest of 13$10K above36West: 29$404K

Christie Park

Established community

725 homes, 100% of homes built before 2010, detached from $885K.

What stands out

  • 1 off-leash dog park inside
  • Established streets: 0% built since 2010, grown-in yards
  • 2 playgrounds, 1 childcare program
  • 19% of the land is park
  • Frequent bus routes cover 99% of the community

Watch for

  • A thin resale record: 31 sales in the window
Entry price
$438K
lowest 25th-percentile sold price of any type
Detached median
$1.31M
15 sales

By home type 12 months to November 3, 2026

TypeMedian soldAgainst WestDays to sellA quarter sold under
Detached15 sales$1.31M4th highest of 23$356K above21West: 18$885K
Townhouse12 sales$452K9th highest of 13$25K below28West: 29$438K

Strathcona Park

Established community

2,407 homes, 99% of homes built before 2010, detached from $768K.

What stands out

  • 3 schools inside the community
  • 3 off-leash dog parks inside
  • 8 playgrounds, 7 childcare programs
  • 18% of the land is park
  • 27 ha of natural area

Watch for

  • Little frequent transit
Entry price
$440K
lowest 25th-percentile sold price of any type
Detached median
$940K
59 sales

By home type 12 months to November 3, 2026

TypeMedian soldAgainst WestDays to sellA quarter sold under
Detached59 sales$940K11th highest of 23$18K below16West: 18$768K
Semi-detached12 sales$541K7th highest of 7$198K below16West: 23$529K
Townhouse14 sales$531K6th highest of 13$54K above28West: 29$440K

Crestmont

Community

1,012 homes, 56% of homes built since 2010, detached from $810K.

What stands out

  • Newest homes in the district: 56% built since 2010
  • 2 playgrounds, 1 childcare program
  • 22 ha of natural area
  • Homes come up often: 6.2% traded in the year
  • No school inside the community

Watch for

  • Little frequent transit
Entry price
$574K
lowest 25th-percentile sold price of any type
Detached median
$895K
42 sales

By home type 12 months to November 3, 2026

TypeMedian soldAgainst WestDays to sellA quarter sold under
Detached42 sales$895K14th highest of 23$64K below20West: 18$810K
Townhouse16 sales$597K2nd highest of 13$120K above42West: 29$574K

Westgate

Established community

1,140 homes, 99% of homes built before 2010, detached from $650K.

What stands out

  • 2 schools inside the community
  • 2 playgrounds, 3 childcare programs
  • Frequent bus routes cover 57% of the community
  • Bungalows: 86% of detached sales were single-level
  • Mostly detached: 80% of homes

Watch for

  • A thin resale record: 58 sales in the window
  • 9% of lots back onto the busiest roads
Entry price
$650K
lowest 25th-percentile sold price of any type
Detached median
$715K
44 sales

By home type 12 months to November 3, 2026

TypeMedian soldAgainst WestDays to sellA quarter sold under
Detached44 sales$715K23rd highest of 23$243K below22West: 18$650K

Rutland Park

Established community

743 homes, 96% of homes built before 2010, detached from $675K.

What stands out

  • 1 school inside the community
  • 1 playground, 2 childcare programs
  • Bungalows: 80% of detached sales were single-level
  • Nearest off-leash dog park: Glamorgan

Watch for

  • A thin resale record: 16 sales in the window
  • Little frequent transit
Entry price
$675K
lowest 25th-percentile sold price of any type
Detached median
$759K
10 sales

By home type 12 months to November 3, 2026

TypeMedian soldAgainst WestDays to sellA quarter sold under
Detached10 sales$759K20th highest of 23$199K below22West: 18$675K

Valley Ridge

Riverside community

1,937 homes, 88% of homes built before 2010, detached from $712K.

What stands out

  • River valley pathways, 3 km of regional pathway
  • 7 playgrounds
  • 26% of the land is park
  • 64 ha of natural area
  • No school inside the community

Watch for

  • 3% of lots back onto the busiest roads
  • Little frequent transit
Entry price
$712K
lowest 25th-percentile sold price of any type
Detached median
$789K
67 sales

By home type 12 months to November 3, 2026

TypeMedian soldAgainst WestDays to sellA quarter sold under
Detached67 sales$789K18th highest of 23$169K below16West: 18$712K

Glendale

Established community

948 homes, 96% of homes built before 2010, detached from $723K.

What stands out

  • Killarney Aquatic & Recreation Centre inside
  • 4 schools inside the community
  • 2 playgrounds, 4 childcare programs
  • Frequent bus routes cover 87% of the community
  • Bungalows: 87% of detached sales were single-level

Watch for

  • A thin resale record: 49 sales in the window
Established areas with older homes, mature trees and bigger lots.
My note
Entry price
$723K
lowest 25th-percentile sold price of any type
Detached median
$793K
46 sales

By home type 12 months to November 3, 2026

TypeMedian soldAgainst WestDays to sellA quarter sold under
Detached46 sales$793K17th highest of 23$166K below20West: 18$723K

Rosscarrock

Community

831 homes, 31% of homes built since 2010, detached from $774K.

What stands out

  • 1 school inside the community
  • Nicholls Family Library inside
  • 2 playgrounds, 4 childcare programs
  • Frequent bus routes cover 83% of the community
  • Bigger detached homes: 86% of detached sales had four or more bedrooms

Watch for

  • A thin resale record: 38 sales in the window
Established areas with older homes, mature trees and bigger lots.
My note
Entry price
$738K
lowest 25th-percentile sold price of any type
Detached median
$895K
14 sales

By home type 12 months to November 3, 2026

TypeMedian soldAgainst WestDays to sellA quarter sold under
Detached14 sales$895K13th highest of 23$63K below30West: 18$774K
Semi-detached18 sales$860K2nd highest of 7$121K above55West: 23$738K

Cougar Ridge

Established community

2,243 homes, 84% of homes built before 2010, detached from $745K.

What stands out

  • 2 schools inside the community
  • 6 playgrounds, 2 childcare programs
  • 22% of the land is park
  • 24 ha of natural area
  • Mostly detached: 87% of homes

Watch for

  • Little frequent transit
Walkable neighbourhoods with modern homes and amenities.
My note
Entry price
$745K
lowest 25th-percentile sold price of any type
Detached median
$815K
77 sales

By home type 12 months to November 3, 2026

TypeMedian soldAgainst WestDays to sellA quarter sold under
Detached77 sales$815K16th highest of 23$143K below15West: 18$745K

Wildwood

Riverside community

1,030 homes, 93% of homes built before 2010, detached from $779K.

What stands out

  • Backs onto the river valley
  • Most park space in the district: 47% of the land
  • 1 school inside the community
  • 1 off-leash dog park inside
  • 6 playgrounds, 5 childcare programs

Watch for

  • A thin resale record: 44 sales in the window
  • Little frequent transit
Established areas with older homes, mature trees and bigger lots.
My note
Entry price
$779K
lowest 25th-percentile sold price of any type
Detached median
$905K
43 sales

By home type 12 months to November 3, 2026

TypeMedian soldAgainst WestDays to sellA quarter sold under
Detached43 sales$905K12th highest of 23$53K below15West: 18$779K

North Glenmore Park

Established community

917 homes, 23% of homes built since 2010, detached from $974K.

What stands out

  • 4 schools inside the community
  • 3 playgrounds, 3 childcare programs
  • 13% of the land is park
  • Frequent bus routes cover 100% of the community
  • Bungalows: 48% of detached sales were single-level

Watch for

  • A thin resale record: 49 sales in the window
  • 7% of lots back onto the busiest roads
Entry price
$974K
lowest 25th-percentile sold price of any type
Detached median
$1.18M
40 sales

By home type 12 months to November 3, 2026

TypeMedian soldAgainst WestDays to sellA quarter sold under
Detached40 sales$1.18M6th highest of 23$222K above26West: 18$974K

Medicine Hill

New community, still being built

198 homes, 100% of homes built since 2010, 4 sales in the window.

What stands out

  • Most park space in the district: 58% of the land
  • Newest homes in the district: 100% built since 2010
  • 1 playground
  • 67 ha of natural area
  • No school inside the community

Watch for

  • A thin resale record: 4 sales in the window
  • Little frequent transit
Entry price
Too few sales
lowest 25th-percentile sold price of any type
Apartment median
Too few sales

Prices: MLS® sales, 12 months to November 3, 2026, shown at 10 or more sales. Parks, schools, playgrounds, childcare, recreation, libraries and off-leash areas: City of Calgary datasets. Shops and services: OpenStreetMap. New builds: builder listings on November 9, 2026. Lake and river: OpenStreetMap water inside or beside the community boundary.

9 of these carry a note from me. What homes cost, by type and by community, comes next.
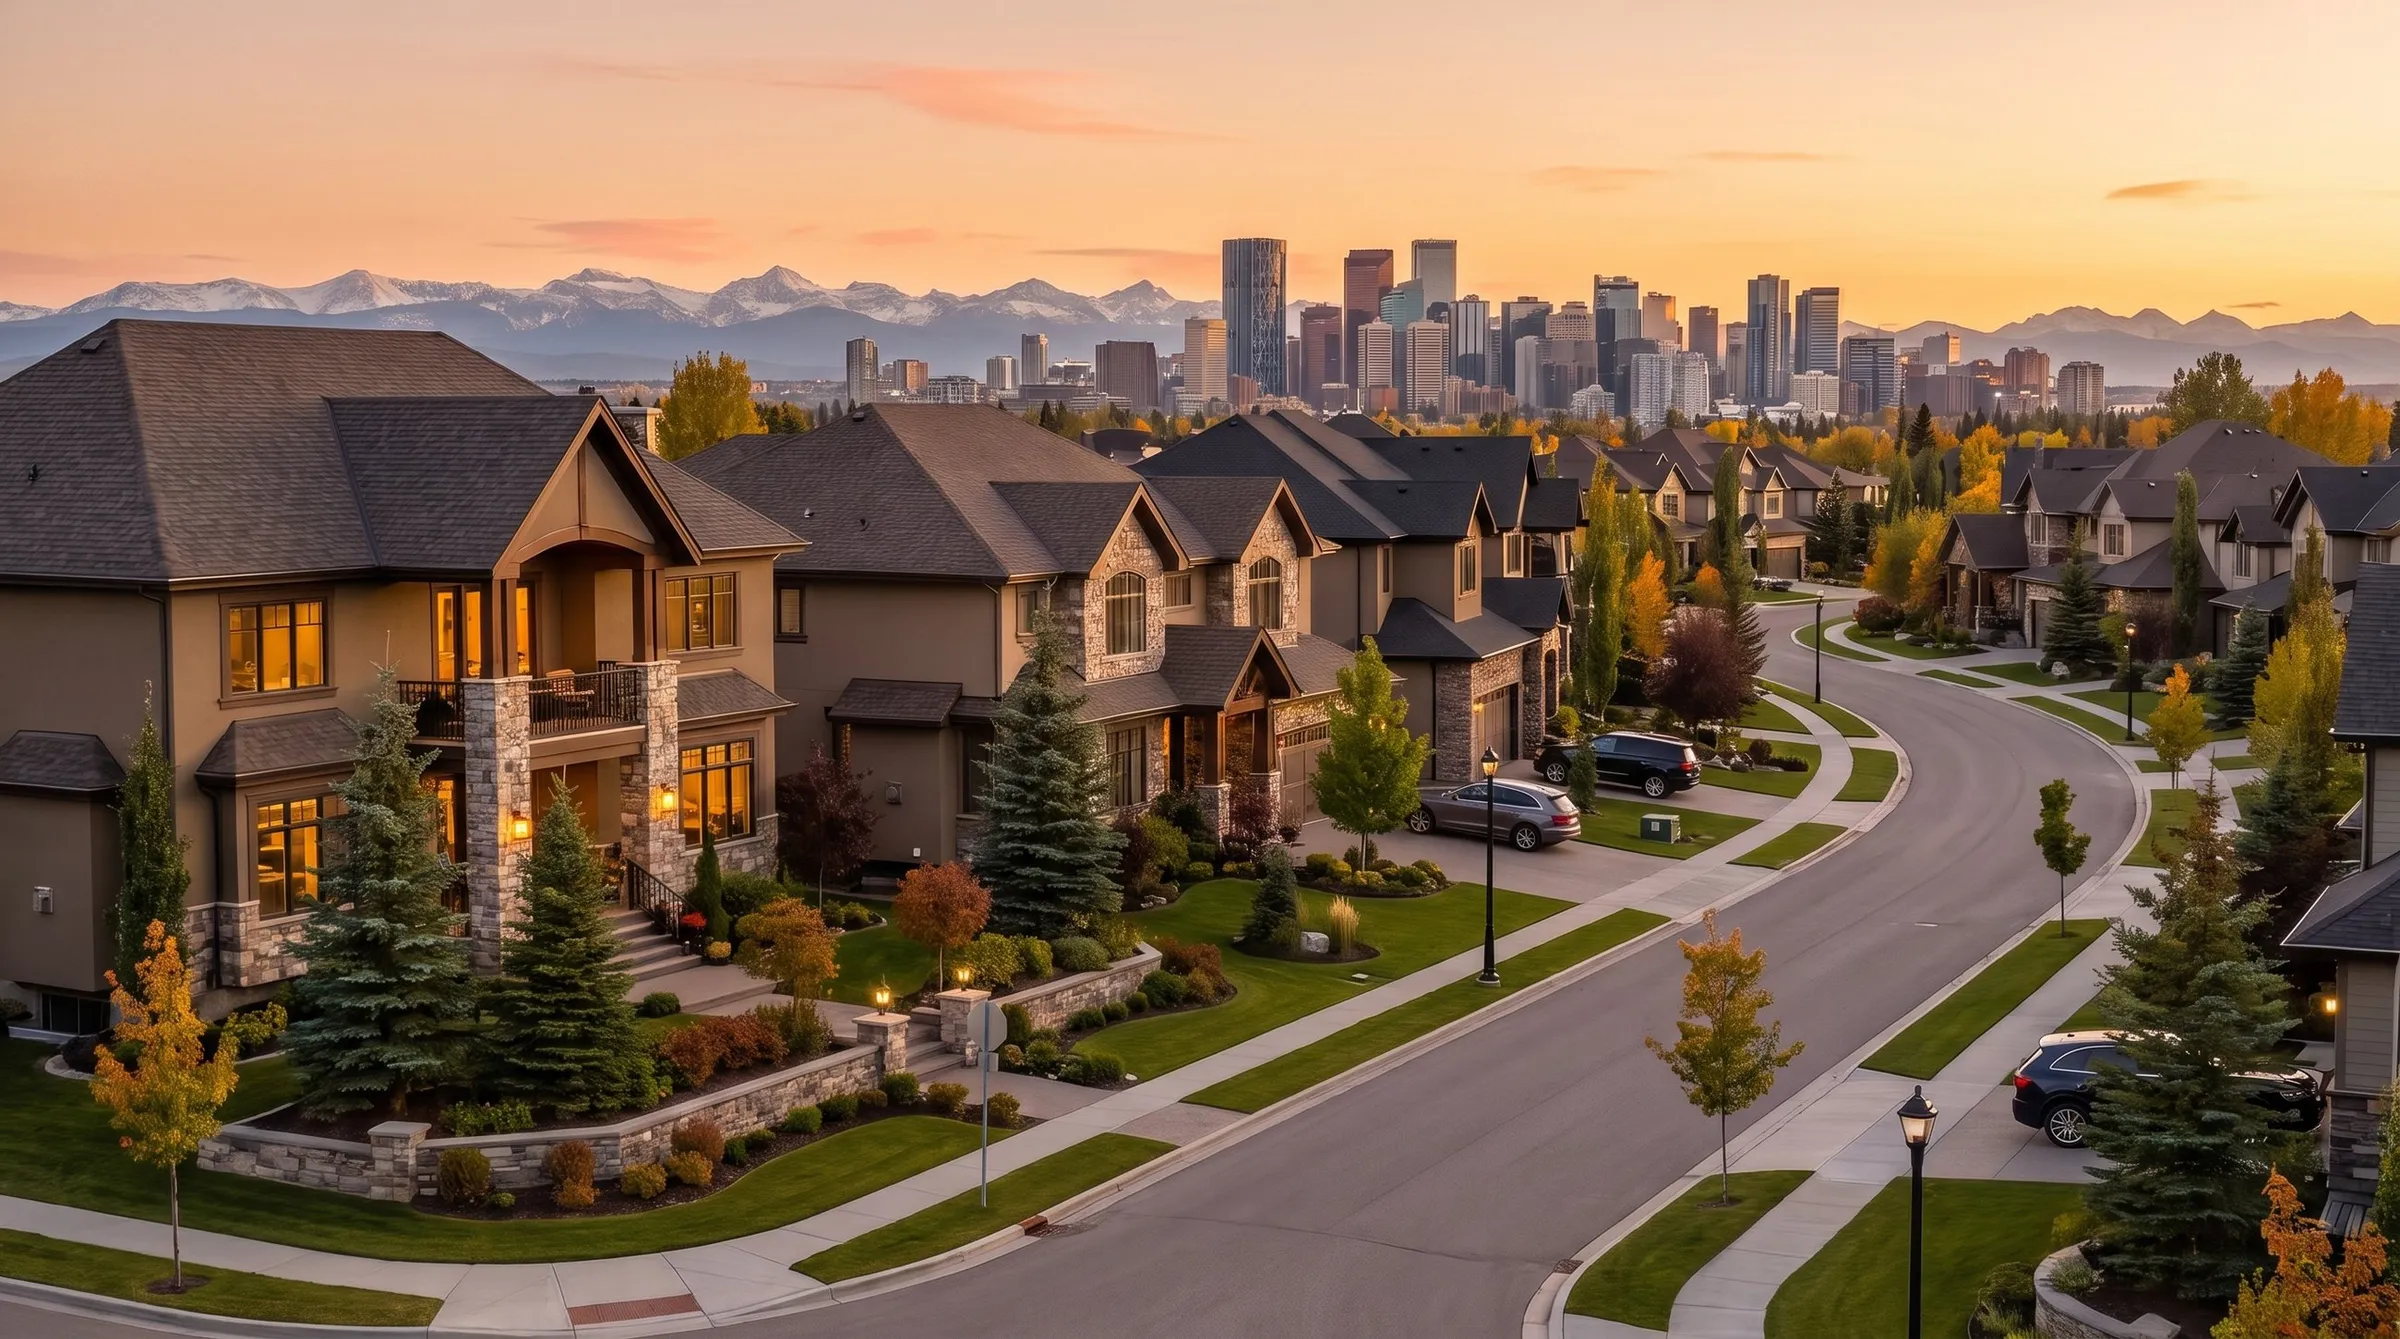
A curving street of large two-storey houses with stone details at sunset, the downtown skyline and the mountains on the horizon.

Prices

What do homes cost in West Calgary?

Over the 12 months to November 3, 2026, a detached home in West Calgary sold for a median of $958,000, 38% over the city's $695,000.

Pick a type. Every community is ranked by its median sold price over the 12 months to November 3, 2026, and the map shades the same figures.

Signal HillWest SpringsSpringbank HillAspen WoodsGlenbrookSpruce CliffGlamorganPattersonCougar RidgeStrathcona ParkDiscovery RidgeValley RidgeLakeviewCoach HillCurrie BarracksLincoln ParkCrestmontNorth Glenmore ParkWestgateRosscarrockGlendaleWildwoodGarrison GreenChristie ParkRutland ParkMedicine Hill

Community medians run from $715K to $1.55M, darker is dearer. Detached sales: the middle 60% sold between $760K and $1.39M, the median at $958K, and the ends mark the 10th and 90th percentiles ($701K and $1.7M). Under 10 detached sales: not shaded.

Community medians run from $541K to $896K, darker is dearer. Semi-detached sales: the middle 60% sold between $566K and $947K, the median at $739K, and the ends mark the 10th and 90th percentiles ($516K and $1.05M). Under 10 semi-detached sales: not shaded.

Community medians run from $293K to $687K, darker is dearer. Townhouse sales: the middle 60% sold between $368K and $620K, the median at $477K, and the ends mark the 10th and 90th percentiles ($314K and $734K). Under 10 townhouse sales: not shaded.

Community medians run from $233K to $485K, darker is dearer. Apartment sales: the middle 60% sold between $250K and $436K, the median at $325K, and the ends mark the 10th and 90th percentiles ($230K and $494K). Under 10 apartment sales: not shaded.

Median detached sold price, shown at 10 or more sales. Darker is dearer.

MLS® sales, 12 months to November 3, 2026

Median semi-detached sold price, shown at 10 or more sales. Darker is dearer.

MLS® sales, 12 months to November 3, 2026

Median townhouse sold price, shown at 10 or more sales. Darker is dearer.

MLS® sales, 12 months to November 3, 2026

Median apartment sold price, shown at 10 or more sales. Darker is dearer.

MLS® sales, 12 months to November 3, 2026

Detached median sold price, highest first

Community medianAll of Calgary: $695K, 24 days to sell

Under 10 detached sales, not ranked: Lincoln Park, Garrison Green and Medicine Hill.

Semi-detached median sold price, highest first

Community medianAll of Calgary: $585K, 28 days to sell

Under 10 semi-detached sales, not ranked: Aspen Woods, Spruce Cliff, Glamorgan, Cougar Ridge, Discovery Ridge, Valley Ridge, Lakeview, Coach Hill, Currie Barracks, Lincoln Park, Crestmont, North Glenmore Park, Westgate, Glendale, Wildwood, Garrison Green, Christie Park, Rutland Park and Medicine Hill.

Townhouse median sold price, highest first

Community medianAll of Calgary: $418K, 32 days to sell

Under 10 townhouse sales, not ranked: Spruce Cliff, Cougar Ridge, Discovery Ridge, Valley Ridge, Currie Barracks, Lincoln Park, North Glenmore Park, Westgate, Rosscarrock, Glendale, Wildwood, Rutland Park and Medicine Hill.

Apartment median sold price, highest first

Community medianAll of Calgary: $295K, 39 days to sell

Under 10 apartment sales, not ranked: Glenbrook, Cougar Ridge, Strathcona Park, Valley Ridge, Lakeview, Crestmont, North Glenmore Park, Westgate, Rosscarrock, Glendale, Wildwood, Christie Park, Rutland Park and Medicine Hill.

Detached, 12 months to November 3, 2026

Median $958KA quarter under $785KHalf sold within 18 daysPer square foot $508Sales 1,115

Sold with four or more bedrooms, the most common size
73%
The size that sells most often here, and its median price.
median $1.02M · 816 sales
Detached sales that were bungalows
29%
How much of what sold was single-level.
12 months to November 3, 2026 · 1,115 sales
Moving up to four or more bedrooms
$195K
A rough guide: bigger homes differ in more than bedrooms.
from three bedrooms, median to median · 276 and 816 sales

Semi-detached, 12 months to November 3, 2026

Median $739KA quarter under $590KHalf sold within 23 daysPer square foot $475Sales 207

Sold with four or more bedrooms, the most common size
46%
The size that sells most often here, and its median price.
median $865K · 96 sales
Semi-detached sales with a condo fee
32%
Most semis here carry no fee. Ask whether the one you like does.
median fee $550 / M · 67 sales
Moving up to four or more bedrooms
$205K
A rough guide: bigger homes differ in more than bedrooms.
from three bedrooms, median to median · 82 and 96 sales

Townhouse, 12 months to November 3, 2026

Median $477KA quarter under $386KHalf sold within 29 daysPer square foot $347Sales 422

Sold with two bedrooms or fewer, the most common size
48%
The size that sells most often here, and its median price.
median $434K · 202 sales
Townhouse condo fee, median , a month
$434
The median fee on townhouse sales that recorded one.
12 months to November 3, 2026 · 416 sales
Townhouse to detached, the step up
$438K
The gap between the median townhouse and the median detached home here, from the assessment roll.
City data, November 9, 2026 · homes-weighted median

Apartment, 12 months to November 3, 2026

Median $325KA quarter under $270KHalf sold within 34 daysPer square foot $373Sales 447

Sold with two bedrooms or fewer, the most common size
97%
The size that sells most often here, and its median price.
median $325K · 432 sales
Apartment condo fee, median , a month
$615
The median fee on apartment sales here.
12 months to November 3, 2026 · 447 sales
Moving up to three bedrooms
$210K
A rough guide: bigger homes differ in more than bedrooms.
from two bedrooms or fewer, median to median · 432 and 15 sales

That's what it costs to get in. How hard buyers push, and when, is the next number.

Negotiation

How hard can you negotiate in West Calgary?

Over the 12 months to November 3, 2026, half the detached homes in West Calgary sold within 18 days, and 31% sold at or over the asking price.Source: MLS® sales, 12 months to November 3, 2026.

One row per type, 12 months to November 3, 2026. The bar under days to sell covers the middle half of sales, with the median marked. A cut compares the final list price with the original one.

The table scrolls sideways: four measures for each type.

Negotiation room by property type: days to sell, sellers who cut, typical cut, and sales at or over list
Property typeDays to sellmedian; bar is the middle halfSellers who cutshare of salesTypical cutmedian, where cutSold at or over listshare of sales
Detached1,115 sales18 daysmiddle half 9 to 40 days26%3.6%31%
Semi-detached207 sales23 daysmiddle half 11 to 52 days30%3.1%26%
Townhouse422 sales29 daysmiddle half 16 to 50 days31%3.7%14%
Apartment447 sales34 daysmiddle half 17 to 57 days32%4.8%13%

Darker cells leave a buyer more room to push, compared across the types here. Days axis 0 to 60.

Most room for a buyer: apartments on days to sell (34 days), apartments on sellers who cut (32%), apartments on the typical cut (4.8%) and apartments on sales at or over list (13%).

Buyer months and seller months

Every sale on record, January 2024 to November 2026, grouped by the month the home was listed and set against this district's own average month.

Homes listed in December closed furthest under asking, at a median 97.9% of list price, and took a median 38 days to sell. Homes listed in February closed closest to asking, at a median 99.1% of list price, and took a median 15 days to sell.

Median sold price as a share of list price, by the month the home was listed, against the average month (98.6%)
Listed inAverage month 98.6%Sold at, % of listDays, medianSales
JanJanuary0.1 points closer to asking than the average month98.7%19507
FebFebruary0.5 points closer to asking than the average month99.1%15581
MarMarch0.4 points closer to asking than the average month99.0%15727
AprApril0.4 points closer to asking than the average month99.0%15756
MayMay0.1 points closer to asking than the average month98.7%16894
JunJune0.2 points closer to asking than the average month98.8%17722
JulJuly0.2 points further under asking than the average month98.4%21610
AugAugust0.1 points further under asking than the average month98.5%20532
SepSeptember0.4 points further under asking than the average month98.2%24583
OctOctober0.4 points further under asking than the average month98.2%20406
NovNovember0.5 points further under asking than the average month98.1%28251
DecDecember0.7 points further under asking than the average month97.9%38150
  • Left, navy: closed further under asking than the average month
  • Right, clay: closed closer to asking than the average month
Signal HillWest SpringsSpringbank HillAspen WoodsGlenbrookSpruce CliffGlamorganPattersonCougar RidgeStrathcona ParkDiscovery RidgeValley RidgeLakeviewCoach HillCurrie BarracksLincoln ParkCrestmontNorth Glenmore ParkWestgateRosscarrockGlendaleWildwoodGarrison GreenChristie ParkRutland ParkMedicine Hill

Months of supply:

  • 1.3 mo to 2.2 mo
  • 2.2 mo to 2.7 mo
  • 2.7 mo to 3.6 mo
  • 3.6 mo to 4.2 mo
  • no figure: Spruce Cliff, Lakeview, Lincoln Park, Rosscarrock, Wildwood, Garrison Green, Christie Park, Rutland Park, Medicine Hill

Days to sell, detached:

  • 12 days to 16 days
  • 16 days to 20 days
  • 20 days to 22 days
  • 22 days to 40 days
  • no figure: Lincoln Park, Garrison Green, Medicine Hill

Benchmark, year over year:

  • -12% to -6%
  • -6% to 0
  • about 0
  • 0 to +6%
  • +6% to +12%
  • no figure: Medicine Hill

CREB® months of supply, all types. Darker means more listings per sale, which favours buyers.

CREB® October 2026

Half the detached homes sold within this many days, shown at 10 or more sales. Darker took longer, which leaves a buyer more room.

MLS® sales, 12 months to November 3, 2026

CREB® benchmark price change over a year. Navy shades fell, clay shades rose, and the lightest held about level.

CREB® October 2026

Months of supply, highest first

No CREB® figure: Spruce Cliff, Lakeview, Lincoln Park, Rosscarrock, Wildwood, Garrison Green, Christie Park, Rutland Park and Medicine Hill.

Days to sell, detached, fastest first

Under 10 detached sales, not ranked: Lincoln Park, Garrison Green and Medicine Hill.

Benchmark price change over a year, biggest rise first

No CREB® figure: Medicine Hill.

Months of supply, all types
3.0 mo
Months to sell everything listed at the current pace. Lower favours sellers.
CREB® October 2026 · 170 sales · CREB® district figure
Benchmark price, year over year
3%
CREB® benchmark for the district, October 2026 against October 2025.
CREB® October 2026 · CREB® district figure
Homes that sold in the year
4.6%
Share of all homes on the roll that changed hands.
City data, November 9, 2026 · homes-weighted median

Getting in is one number. Holding it, month after month, is a different one.

Cost to hold

What does it cost to own a home in West Calgary, month to month?

Owning the median detached home in West Calgary costs $5,340 a month in mortgage, property tax and any recorded condo fee, at 4.12% to 4.58% with the minimum down payment, before utilities.Source: my ownership model on MLS® sales, 12 months to November 3, 2026; Bank of Canada new-mortgage rates, August 2026.

Monthly cost to own the median home, by type

Mortgage, property tax and the recorded condo fee, at 4.12% to 4.58% over 25 years

Detached , a month
$5,340
On the median price with the minimum down payment, before utilities.
Income to qualify about $196,000
Semi-detached , a month
$4,740
On the median price with the minimum down payment, before utilities.
Income to qualify about $175,000
Townhouse , a month
$3,440
On the median price with the minimum down payment, before utilities.
Income to qualify about $115,000
Apartment , a month
$2,550
On the median price with the minimum down payment, before utilities.
Income to qualify about $81,000

$533 a month per $100,000 borrowed

Rate used: 4.12% with under 20% down (insured), 4.58% with 20% or more: what chartered banks actually charged on new 5-year fixed mortgages in August 2026 (Bank of Canada). Property tax at the 2026 City rate on the assessed value.

Condo fees by building age

Median monthly fee on apartment and townhouse resales, 12 months to November 3, 2026, grouped by the decade the building went up.

The highest is on buildings from the 2000s, $567 a month. The lowest is on buildings from 2020 or later, $302. From 863 resales that recorded a fee.

  1. Before 2000 (344 resales): $562
  2. 2000s (267 resales): $567
  3. 2010s (128 resales): $470
  4. 2020 and newer (124 resales): $302
Two-bedroom rent , a month
$2,069
CMHC average, October 2025, weighted across the district. What staying a renter costs.
City data, November 9, 2026 · homes-weighted median
Own minus rent, two-bedroom apartment
$550
Monthly cost to own the median two-bedroom apartment, less the rent for one.
City data, November 9, 2026 · 281 sales · sales-weighted median
Gross yield, two-bedroom apartment
7.5%
Annual rent as a share of the median two-bedroom apartment price.
City data, November 9, 2026 · 281 sales · sales-weighted median
Gross yield, two-bedroom townhouse
6.1%
Annual rent as a share of the median two-bedroom townhouse price.
City data, November 9, 2026 · 158 sales · sales-weighted median
Approved secondary suites per 100 homes
4.7
Registered suites on the City list, per 100 homes.
City data, November 9, 2026 · homes-weighted average
Licensed short-term rentals per 1,000 homes
2.6
City licences per 1,000 homes.
City data, November 9, 2026 · homes-weighted median
Water main breaks per 100 homes, ten years
0.4
City records over ten years. Newer pipe breaks less.
City data, November 9, 2026 · homes-weighted average
Public trees that are mature
17%
Share of the City tree inventory here that is fully grown. Newer districts read low.
City data, November 9, 2026 · homes-weighted average
Signal HillWest SpringsSpringbank HillAspen WoodsGlenbrookSpruce CliffGlamorganPattersonCougar RidgeStrathcona ParkDiscovery RidgeValley RidgeLakeviewCoach HillCurrie BarracksLincoln ParkCrestmontNorth Glenmore ParkWestgateRosscarrockGlendaleWildwoodGarrison GreenChristie ParkRutland ParkMedicine Hill

Monthly cost, detached:

  • $4,099 to $4,509
  • $4,509 to $5,120
  • $5,120 to $6,581
  • $6,581 to $7,870
  • no figure: Lincoln Park, Garrison Green, Medicine Hill

Monthly cost, apartment:

  • $1,893 to $2,104
  • $2,104 to $2,468
  • $2,468 to $2,755
  • $2,755 to $3,390
  • no figure: Glenbrook, Cougar Ridge, Strathcona Park, Valley Ridge, Lakeview, Crestmont, North Glenmore Park, Westgate, Rosscarrock, Glendale, Wildwood, Christie Park, Rutland Park, Medicine Hill

Townhouse condo fee:

  • $265 to $378
  • $378 to $475
  • $475 to $548
  • $548 to $674
  • no figure: Spruce Cliff, Cougar Ridge, Discovery Ridge, Valley Ridge, Currie Barracks, Lincoln Park, North Glenmore Park, Westgate, Rosscarrock, Glendale, Wildwood, Rutland Park, Medicine Hill

Apartment condo fee:

  • $412 to $531
  • $531 to $583
  • $583 to $659
  • $659 to $770
  • no figure: Glenbrook, Cougar Ridge, Strathcona Park, Valley Ridge, Lakeview, Crestmont, North Glenmore Park, Westgate, Rosscarrock, Glendale, Wildwood, Christie Park, Rutland Park, Medicine Hill

Gross yield, 2-bed:

  • 5.2% to 5.4%
  • 5.4% to 6.7%
  • 6.7% to 8%
  • 8% to 9.3%
  • no figure: Cougar Ridge, Strathcona Park, Valley Ridge, Lakeview, Crestmont, North Glenmore Park, Westgate, Rosscarrock, Glendale, Wildwood, Garrison Green, Christie Park, Rutland Park, Medicine Hill

Two-bedroom rent:

  • $1,673 to $2,052
  • $2,052 to $2,069
  • $2,069 to $2,797

Mortgage, tax and fee on the median detached home at 4.12% to 4.58%, with the minimum down payment. Darker costs more a month.

Ownership model, Bank of Canada new-mortgage rates, August 2026

Mortgage, tax and fee on the median apartment at 4.12% to 4.58%, with the minimum down payment. Darker costs more a month.

Ownership model, Bank of Canada new-mortgage rates, August 2026

Median monthly condo fee on the townhouse resales that recorded one. Darker is higher.

MLS® sales, 12 months to November 3, 2026

Median monthly condo fee on apartment resales. Darker is higher.

MLS® sales, 12 months to November 3, 2026

Annual CMHC two-bedroom rent over the median two-bedroom price, before costs. Darker is higher.

CMHC rents, October 2025; MLS® sales

CMHC average two-bedroom rent, by tract or zone. Darker is dearer.

CMHC rents, October 2025

Monthly cost, detached, highest first

Too few detached sales: Lincoln Park, Garrison Green and Medicine Hill.

Monthly cost, apartment, highest first

Too few apartment sales: Glenbrook, Cougar Ridge, Strathcona Park, Valley Ridge, Lakeview, Crestmont, North Glenmore Park, Westgate, Rosscarrock, Glendale, Wildwood, Christie Park, Rutland Park and Medicine Hill.

Townhouse condo fee, highest first

Too few townhouse sales with a fee: Spruce Cliff, Cougar Ridge, Discovery Ridge, Valley Ridge, Currie Barracks, Lincoln Park, North Glenmore Park, Westgate, Rosscarrock, Glendale, Wildwood, Rutland Park and Medicine Hill.

Apartment condo fee, highest first

Too few apartment sales with a fee: Glenbrook, Cougar Ridge, Strathcona Park, Valley Ridge, Lakeview, Crestmont, North Glenmore Park, Westgate, Rosscarrock, Glendale, Wildwood, Christie Park, Rutland Park and Medicine Hill.

Gross yield, 2-bed, highest first

Too few two-bedroom sales: Cougar Ridge, Strathcona Park, Valley Ridge, Lakeview, Crestmont, North Glenmore Park, Westgate, Rosscarrock, Glendale, Wildwood, Garrison Green, Christie Park, Rutland Park and Medicine Hill.

Two-bedroom rent, highest first

Those are the carrying numbers. Daily life is what you're carrying them for.

Daily life

What is daily life like in West?

53 schools and 124 City playgrounds sit inside West, with 20.1 licensed childcare spaces for every 100 children under 15. City data, November 9, 2026.
Signal HillWest SpringsSpringbank HillAspen WoodsGlenbrookSpruce CliffGlamorganPattersonCougar RidgeStrathcona ParkDiscovery RidgeValley RidgeLakeviewCoach HillCurrie BarracksLincoln ParkCrestmontNorth Glenmore ParkWestgateRosscarrockGlendaleWildwoodGarrison GreenChristie ParkRutland ParkMedicine Hill

53 schools inside West, all boards and levels. A school shows under every level it teaches.

41 elementary schools inside West. Hover one for its name.

32 schools teaching junior high inside West. Hover one for its name.

19 schools teaching senior high inside West. Hover one for its name.

136 parks of a hectare or more and 124 City playgrounds inside West.

136 parks of a hectare or more inside West.

124 City playgrounds inside West.

6 recreation facilities and 2 public libraries inside West. Hover one for its name.

6 recreation facilities inside West. Hover one for its name.

2 public libraries inside West. Hover one for its name.

  • Schools 53
  • Playgrounds 124
  • Recreation facilities 6
  • Libraries 2
  • Parks 136

City locations. Schools, recreation facilities and libraries show their names on hover.

City of Calgary open data: schools, November 1, 2026; playgrounds, November 8, 2026; recreation facilities, November 8, 2026; libraries, February 21, 2025; parks, November 5, 2026.

Schools inside the district
53
All boards and levels, City school locations.
City data, November 9, 2026 · district total
Childcare spaces per 100 children under 15
20.1
Licensed spaces against the children on record.
City data, November 9, 2026 · per child under 15
Playgrounds
124
City playground equipment sites.
1 per 1,000 residents · City data, November 9, 2026 · district total
Park space per 1,000 residents
7.7 ha
Hectares of City park per 1,000 residents.
City data, November 9, 2026 · per resident
Grocery stores
42
OpenStreetMap count inside the district.
City data, November 9, 2026 · district total
Restaurants
371
OpenStreetMap counts inside the district.
Also 82 cafes, 43 pharmacies, 21 gyms · City data, November 9, 2026 · district total

How West feels

  • Established and unhurried: less density, more space, larger homes.
  • Quieter streets and calmer traffic, with neighbourhoods tucked into rolling hills and wooded areas.
  • A clear sense of elevation and privacy, physically and socially.
  • Where a lot of people move when they're done with downtown noise.

What locals say

“You pay more out here, but you feel it in the lifestyle. We have space, trails and actual stars at night.”

“We moved from the inner city once we had kids. It's peaceful, and we still get downtown in 20 minutes.”

“It's underrated.”

School attendance areas change; check the CBE and Catholic school finders for any address.

The households on record come next.

Households

Who lives in West Calgary?

In the 2021 Census, 124,050 residents lived in West Calgary, in 48,115 households, and 75% of households owned their home.Source: Statistics Canada 2021 Census, as the City of Calgary publishes it by community.
Residents
124,050
2021 Census, population in private households.
2021 Census · district total
Growth, 2014 to 2019
3%
Population change between the City's 2014 and 2019 civic censuses, across the district.
City of Calgary civic census, 2014 to 2019 · population-weighted average
Households
48,115
2021 Census households.
2021 Census · district total
Residents under 15
18.9%
Share of residents aged 0 to 14.
2021 Census · population-weighted average

Household size

Share of households by number of people. Average 2.6.

  1. One person: 25%
  2. Two people: 32%
  3. Three people: 16%
  4. Four people: 18%
  5. Five or more: 9%

People in the household, 2021 Census

Owners

75% of households own their home. One square is one household in a hundred.

  • 75 of 100 own their home
  • 25 of 100 don't

2021 Census · household-weighted average

Couples with children at home
51%
Share of census families.
2021 Census · household-weighted average
One-parent families
13%
Share of census families.
2021 Census · household-weighted average
Commute by transit
7%
Share of commuters, 2021 Census.
2021 Census · population-weighted average
Commute of 30 minutes or more
29%
Share of commuters, 2021 Census.
2021 Census · population-weighted average
Signal HillWest SpringsSpringbank HillAspen WoodsGlenbrookSpruce CliffGlamorganPattersonCougar RidgeStrathcona ParkDiscovery RidgeValley RidgeLakeviewCoach HillCurrie BarracksLincoln ParkCrestmontNorth Glenmore ParkWestgateRosscarrockGlendaleWildwoodGarrison GreenChristie ParkRutland ParkMedicine Hill

Homes built since 2010:

  • 0% to 2%
  • 2% to 6%
  • 6% to 23%
  • 23% to 100%

Mature public trees:

  • 0% to 5%
  • 5% to 16%
  • 16% to 35%
  • 35% to 44%

Share of homes on the assessment roll built in 2010 or later. Darker is newer.

City of Calgary 2026 assessment roll

Share of the City's public trees here that are fully grown. Newer streets read low. Darker is more.

City of Calgary tree inventory

Homes built since 2010, newest first

Mature public trees, highest first

Now the part of the file that buyers skip and lawyers don't.

Before you offer

What should you check before you offer in West?

City of Calgary maps put none of West's 33,077 residential lots in the 1:100 flood zone and none inside the NEF 25 aircraft noise band, as of November 9, 2026.
Signal HillWest SpringsSpringbank HillAspen WoodsGlenbrookSpruce CliffGlamorganPattersonCougar RidgeStrathcona ParkDiscovery RidgeValley RidgeLakeviewCoach HillCurrie BarracksLincoln ParkCrestmontNorth Glenmore ParkWestgateRosscarrockGlendaleWildwoodGarrison GreenChristie ParkRutland ParkMedicine Hill
  • Floodway
  • Flood fringe
  • Freight rail
  • Busiest roads (2024 counts)

The City's own hazard maps. Hover a busy road for its 2024 count.

City of Calgary: regulatory flood map, September 3, 2026; noise exposure forecast contours, October 1, 2026; non-LRT tracks, October 1, 2026; 2024 traffic volumes, August 5, 2025.

Each tile is the share of the district's residential lots that one City hazard layer touches. I name a community when 10% or more of its lots sit in the flood zone, 20% or more inside the noise band or beside freight rail, or 5% or more beside one of the busiest roads.

Lots in the 1:100 flood zone
0%
No community at 10% of lots or more · 33,077 lots
Lots in the floodway
0%
33,077 lots
Lots inside the NEF 25 noise band
0%
No community at 20% of lots or more · 33,077 lots
Lots beside the busiest roads
1%
Highest three at 5% of lots or more: Westgate (8.8%), North Glenmore Park (6.8%), Garrison Green (5.2%) · 33,077 lots
Lots beside freight rail
0.1%
No community at 20% of lots or more · 33,077 lots
Lots inside a landfill setback
0%
33,077 lots

Share of residential lots · City data, November 9, 2026

Weather and the outdoors

Sun exposure

More sun and less wind than the North East or North West, especially on south-facing slopes.

Snow

Moderate snowfall that melts quickly on the sunny slopes around Cougar Ridge and Signal Hill.

Natural beauty

Tree-lined streets, ridge-top trails and the Glenmore Reservoir pathways are part of daily life.

Hail

The costliest recent storms hit the north and north-east, but hail is a city-wide risk. Check roof age.

This district feels more refined, and the weather can be a little kinder too: less wind and faster snowmelt on the slopes.

Four things I check on your behalf here

  1. Walkouts and slopes

    Steep driveways, retaining walls and hillside drainage are common here. They are fine when maintained and expensive when they are not.

  2. Ask what it costs to run

    Bigger homes cost more to heat and cool. Ask the seller for a year of utility bills before you set your budget.

  3. Check for architectural controls

    Some west-side communities carry design rules or homeowner association fees registered on title.

  4. Warranty on newer builds

    If the home is under 10 years old, find out what is left on the Alberta new home warranty and whether it transfers.

What's being built next door changes all of this over time.

What's coming

What is coming to West Calgary?

The City permitted 2,767 housing units in West Calgary in the 24 months to November 6, 2026, and builders were advertising 1 new homes here on November 9, 2026 (City of Calgary building permits; builders' public listings).
Signal HillWest SpringsSpringbank HillAspen WoodsGlenbrookSpruce CliffGlamorganPattersonCougar RidgeStrathcona ParkDiscovery RidgeValley RidgeLakeviewCoach HillCurrie BarracksLincoln ParkCrestmontNorth Glenmore ParkWestgateRosscarrockGlendaleWildwoodGarrison GreenChristie ParkRutland ParkMedicine HillWest Springs: 1 new-build listings

Units permitted, 24 months:

  • 0 to 1
  • 1 to 19
  • 19 to 77
  • 77 to 1,514

New-build listings:

  • 0 to 1

Units planned:

  • 265 to 466
  • 466 to 2,164
  • 2,164 to 2,502
  • 2,502 to 3,203
  • no figure: Signal Hill, Glenbrook, Spruce Cliff, Glamorgan, Patterson, Cougar Ridge, Strathcona Park, Discovery Ridge, Valley Ridge, Lakeview, Coach Hill, Currie Barracks, Lincoln Park, North Glenmore Park, Westgate, Rosscarrock, Glendale, Wildwood, Garrison Green, Christie Park, Rutland Park

Key:

  • New-build listings, circle size is the count
  • Regional pathways

Housing units the City permitted in two years. Darker is more.

City of Calgary building permits, 24 months to November 6, 2026

Homes builders were advertising in the community on the date shown. Darker is more.

builders' public listings, November 9, 2026

Units in approved outline plans and area structure plans, on land not yet built. Darker is more.

City of Calgary, November 9, 2026

Units permitted, 24 months, highest first

New homes builders are advertising, most first

Units planned, highest first

None on record: Signal Hill, Glenbrook, Spruce Cliff, Glamorgan, Patterson, Cougar Ridge, Strathcona Park, Discovery Ridge, Valley Ridge, Lakeview, Coach Hill, Currie Barracks, Lincoln Park, North Glenmore Park, Westgate, Rosscarrock, Glendale, Wildwood, Garrison Green, Christie Park and Rutland Park.

Housing units permitted, 24 months
2,767
New homes the City approved here in two years.
City data, November 9, 2026 · district total
Units planned on land not yet built
8,134
Approved outline plans and area structure plans, City of Calgary.
City data, November 9, 2026 · district total
New-build listings live
1
Homes builders were advertising in the district on the date shown.
1 builders active · builders' listings, November 9, 2026
Builder price cuts, 8 weeks
2
Builder listings whose asking price fell in the last eight weeks.
builders' listings, November 9, 2026 · district total
Development permit applications, 24 months
372
Residential development permits applied for.
City data, November 9, 2026 · district total
Land-use redesignation applications, 24 months
45
Rezoning applications in the district.
City data, November 9, 2026 · district total

The builder advertising here: Cedarglen.

What I expect to change

  • EstablishedLargely developed. You're buying into a settled environment with little disruption ahead.
  • InfillCommon closer to the core in Wildwood and Spruce Cliff; most of the west side stays low-density.
  • Ring roadTsuut'ina Trail, the SW ring road, opened in 2023 and cut cross-city trips from the deep southwest.
  • AmenitiesRetail and dining keep improving around West Springs and Aspen Woods.

There's not a lot of surprise here, and for most West buyers that's the appeal. Your street won't change overnight, though the older home next door might become a modern build.

If you'd rather see it than read it, the tour is next.

A wide view across rooftops and treetops to a lake and the city beyond.

Is it for you

Is West right for you?

  • You want peace and privacy

    Spacious homes on quiet streets.

  • You work downtown but want to feel far from it

    A calm evening with a reasonable commute.

  • You value space and nature over nightlife

    Outdoor access over urban entertainment.

  • You'll pay more for quality and calm

    Premium homes with long-term value.

West Calgary is where lifestyle meets legacy. If you're at a stage where calm and connection matter, put it near the top of your list.

West · 26 residential communities · 46,915 homes

See it before you visit

Hidden Gems & Best Communities in Calgary: the full guide. My walkthrough of every Calgary region; it loads from YouTube when you press play.

Watch the market updates

Still have questions?

Is there something you'd like to know?

I'd be happy to help. Tell me your budget and the communities you circled in West, and I'll show you what actually sold there.

Book a call(opens in a new tab)Read testimonials

Sources

MLS® sales, 12 months to November 3, 2026 · CREB® October 2026 · builders' public listings, November 9, 2026 · City of Calgary open data · OpenStreetMap · CMHC · Bank of Canada, August 2026 · 2021 Census. No median under 10 sales. Photographs are illustrations.

How each figure is built
  • Sales. Medians and price curves: MLS® sales in Ash Iyer's archive, 12 months to November 3, 2026. Price per square foot uses the listing's recorded floor area. Negotiation figures cover the same window; the monthly pattern uses every sale on record for this district, grouped by listing month (close date minus days on market).
  • CREB®. Months of supply and benchmark change: CREB® district statistics for October 2026. Source: CREB®.
  • New construction. New builds: homes advertised in builders' public listings, November 9, 2026.
  • Getting around. Drive times: OpenStreetMap routing from each community's centre, no traffic model, so treat them as a floor. Transit, bikeways, pathways and snow routes: City of Calgary. CTrain: a station within 1.2 km, straight line.
  • Ownership costs. Monthly cost to own: Ash Iyer's ownership-cost model at the minimum down payment, with the rate chartered banks actually charged on new 5-year fixed mortgages in August 2026 (Bank of Canada: 4.12% insured, under 20% down; 4.58% uninsured), 25-year amortisation, 2026 tax rate and the recorded condo fee. Rents: CMHC, October 2025. Suites and short-term rentals: City of Calgary.
  • Housing stock. Homes, construction era, turnover and the move-up step: City of Calgary 2026 assessment roll (valued July 1, 2025) and MLS® sales.
  • Supply pipeline. Building permits, development permits, land-use redesignations and planned units: City of Calgary open data, Oct 2026; 24 months to 2026-11-06.
  • Schools family. City of Calgary school, childcare, playground, recreation, library, parks and health datasets. Amenity counts: OpenStreetMap.
  • Risk diligence. Flood, aircraft noise, busy roads, rail and landfill setbacks: City of Calgary open data (1:100 flood map 2023, NEF contours, 2024 traffic volumes). Water main breaks: City of Calgary, ten years.
  • People. 2021 Census by community and the City's civic census (City of Calgary open data). Descriptive only: this describes the households and housing on record, not who should live here.
  • Roll-ups. median of communities: median across the district's residential communities (200 or more homes), commute minutes rounded up; sales-weighted median: median across the district's community and property-type records, weighted by sales; homes-weighted median: median across the district's communities, weighted by homes; homes-weighted average: average across the district's communities, weighted by homes; household-weighted average: average across the district's communities, weighted by households; population-weighted average: average across the district's communities, weighted by residents; area-weighted average: average across the district's communities, weighted by land area; share of residential lots: share of all residential lots in the district's communities; share of homes: share of all homes in the district's communities; district total: total across the district's communities; per resident: total across the district's communities, per resident; per child under 15: total across the district's communities, per child under 15; CREB® district figure: CREB® district figure, as published; derived from the figures beside it: derived from the figures beside it.
  • Floors. No median is shown under 10 sales; no listing month under 15 sales. Figures refresh when the sales archive or the weekly data run updates, and every date on this page is read from the data.
  • Map. City of Calgary community boundaries (Open Data Terms of Use), grouped by CREB district; OpenStreetMap water bodies via Overpass (ODbL), fetched 2026-11-13.
  • Photographs. Illustrations of the district, not photographs of a specific street or home.